Rain and Rainfall—Great Britain—Periodicity—Periodicals
The quest for a “perfect patterne”
Edward Eigen
Oft expectation fails, and most oft there
Where most it promises.
—William Shakespeare, All’s Well that Ends Well (Act II, Scene I)
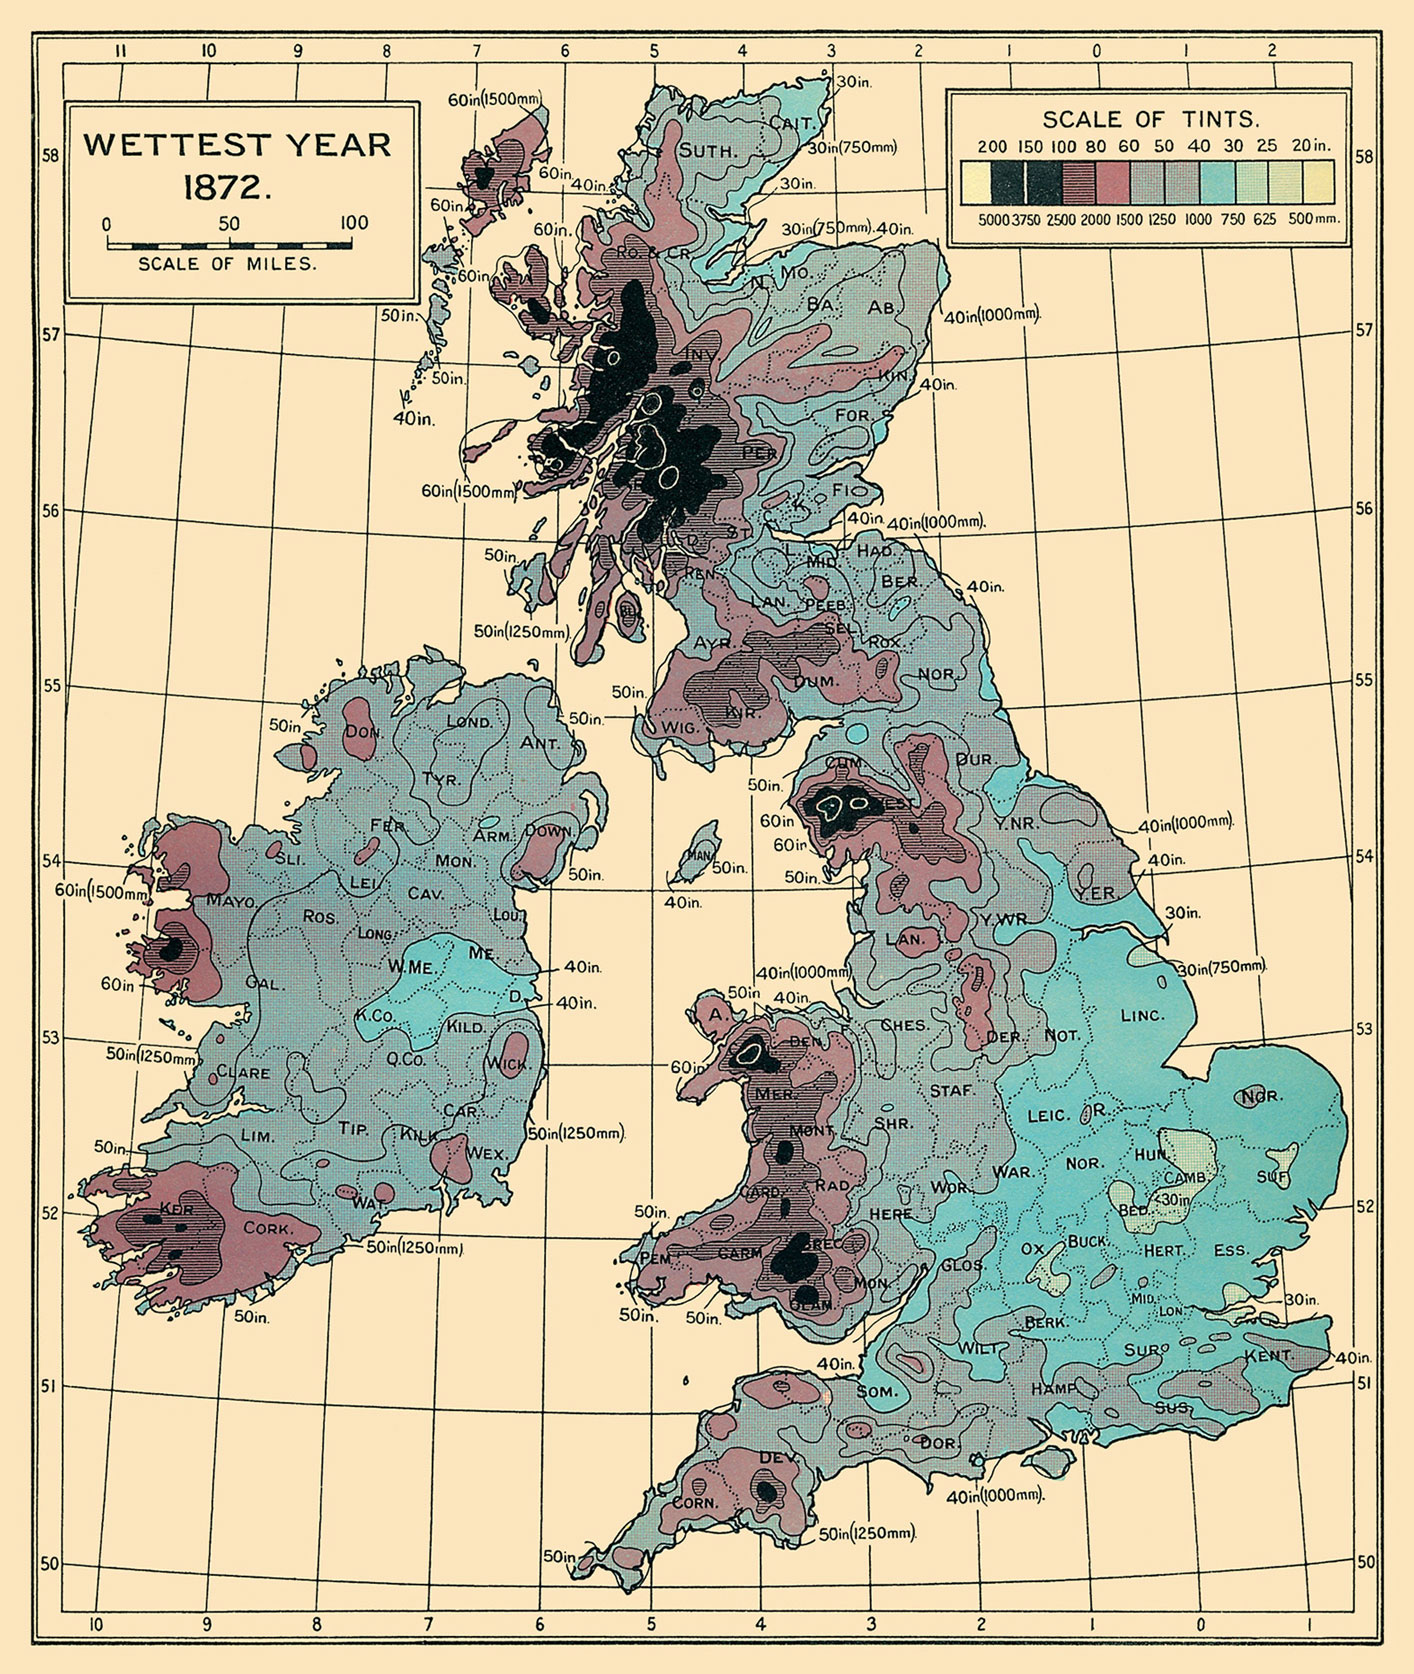
About the title. It is drawn from the subject heading under which, in the catalogue of the New York Public Library, appears a single and singular item: the periodical British Rainfall. Issued by the Meteorological Office, this “regular annual publication” was devoted to the study of the “distribution of rain in space and time over the British Isles.” The Meteorological Office—imagine musty chambers in which masses of data are sorted and shuffled in search of a governing rule, a perfect patterne—was the successor to the still more august-sounding British Rainfall Organization. Established in 1858 by George James Symons, an exemplar of the Victorian obsession with statistics, the British Rainfall Organization made the British Isles a realm of watchful, patchily distributed observers. What was the weather like, say, on 1 December 1860, the date Charles Dickens—who all but invented London’s fog—published the first installment of Great Expectations in All the Year Round: A Weekly Journal? (In London: barometric pressure 29.66", temperature 45˚, wind from the east, overcast. That is, about what you would expect.) Rain and Rainfall—Great Britain—Periodicity—Periodicals. What kind of subject is this, so tightly corseted by inflexible hyphens? Does it yield to the smoothing and curve-fitting techniques of the mathematician? Or is it an irregular conjunction of things, somehow fixed in time, the meaning and sense of which only the poet can hope to scan? That it answers to neither and both of these descriptions will be shown in the following attempt to coax from it, however improbably, a thesis on history.
Our focus will be upon a group of mid-1920s papers, culled from journals on meteorology, statistics, and geography, whose authors were testing new methods for spotting undetected periodicities in time series (sequences of observational data). Thus we will be on a “muddy road,” retracing the steps of these seekers of order—or of the screwily ordinal nature of data—as they plotted what all signs had led to them believe was the sinusoidal shape of time. The question such inquiry poses is whether there is a (straight, curving, zigzag, broken, continuous) plot to history and if so, how it should be limned. The reasoning runs as follows: in the recorded history of rainfall, made up of countless particulars which seem not so much to depart from as never care to approach the general reason of things, is written the prospect of a future regularity. This tenuous connection, between the once was and the not yet, breaks down not only of its own accord; it is uninterruptedly available to external disturbance. Model that disturbance and win the day, and days past, and days to come.
What we shall consider is a once seemingly possible merger between the Meteorological Office and that of the historian. Records were their common stock in trade. Time, order, and causation were the stuff of their shared meditation on before and after, on the consecution of tenses. Where the historians and meteorologists failed to come to terms was with what appeared likely in the unapprehended relations of things. Confronted with a tumultuous mass of facts, the historian loses sight of the presumable shape of time; the meteorologist finds in it a latent pattern. In his essay “Hypercritica, Or A Rule of Judgment For Writing or Reading Our Histories” (ca. 1618), Edmund Bolton writes, regarding varied opinions about how Britain came to be named Britain, “[I]f anything be clear in such a Case, or vehemently probable, it is both enough, and all which the Dignity of an Historian’s office doth permit.” Could students of the constitutively inconstant weather ask for any greater degree of certainty? It seems so. They heard secret harmonies, periodic rhythms repeated years on end.
A final preliminary word about periodicals. They appear weekly, fortnightly, quarterly, or at some other nominally regular interval. Except when they fail to do so. Particularly with laboriously tabulated meteorological data, the attempt to keep up with the present often proves the source of delay. Symons placed the blame for the chronically late appearance of British Rainfall on the negligence of his correspondents and on the time needed to correct errors in the records they eventually submitted. Better late than never. “Gave up hope of more,” reads the note appended to the catalogue entry for the Supplement to British Rainfall (1961–1965). A break in communication, a dry spell, a printers’ strike, the inexhaustible logic of the supplement? How do we read this desperate note? Was the cataloguer’s darkening hope that this regular annual publication would complete its run, the distribution of rain in space and time ever tending to norm? Or was it that the regular annual publication would merely resume, if only for appearance’s sake? Certainly there is always rain on the way. But what proves more difficult and correspondingly more rewarding to bring into line, editorially and otherwise, is that which is most subject to precipitate change: the past. Correction: make that history.
The relevant clue to the method of history’s productive unmaking, indeed the very model of a purposefully “roving and unsettled” discourse, is to be found in Thomas Sprat’s The History of the Royal-Society of London (1667), where also may be consulted Robert Hooke’s synoptical “Method For Making a History of the Weather.” We refer specifically to Sprat’s description of the Fellows’ manner of compiling their Registers, so that they might be “nakedly transmitted to the next Generation of Men; and so from them to their Successors … without digesting them into any perfect model: so to this end, they confin’d themselves to no order of subjects; and whatever they have recorded, they have done it, not as compleat Schemes of opinions, but as bare unfinish’d Histories.”[1] Evidently to learn from the past is as much a matter of saving its lessons from as saving them for an uncertain posterity. In this garden of the text, the nakedness of history is a manufactured state of grace, the better to weather the storms of time.
Here, at last, is the argument: “in his bare was,” the historian “is so tied, not to what should be, but to what is, to the particular truth of things, that his example draweth no necessary consequence.” And the philosopher, for his part, in his “bare rule,” gives the precept for what should be, without convincingly showing why it is so. The argument, such as it is, comes from Sir Philip Sidney, The Defence of Poesie (published 1595), whom we have been ventriloquizing all along: the perfect patterne, the general reason of things. Here is another flower: The mathematician might draw forth a straight line with a crooked heart.[2] Sidney was legendarily a fatal victim of the weather, about which destiny more below. Though what made him a mantic poet of rainfall are his reflections on how to “coupleth the generall notion with the particuler example,” the philosopher’s precept with the historian’s example.
A specialist in prehistoric meteorology, Brooks was as well versed in the documentary record of the weather as in physical traces of climates past, including tree rings and varves (from the Swedish word for a cycle, varves are annual sedimentary layers used by geochronologers to establish glacial timescales). But how to detect cycles from something as fleeting as the rain? So variable is the weather of the British Isles, Brooks and Glasspoole write, that it is aptly described as made up of instantaneous “samples.” One possible response is to slant the significance of variation in favor of constancy. The late nineteenth- and early twentieth-century meteorologist Eduard Brückner observed that while weather connotes instability, climate implies stability, with conditions changing from place to place (most notably orographically) but not over time. Time, which is said to flow, percolate, eddy, and swirl, thus appears a medium of constancy. Brückner’s subsequent analysis is notable for his attempt to gerrymander the boundaries of variation. He noted that for as many regions experiencing regular oscillation in rainfall, temperature, and atmospheric pressure, there were also numerous “regions of permanent exception,” and still others which for a time followed a regular pattern only to suddenly depart from it; these he classed “regions of temporary exception.”[4] Brückner’s more or less well-documented expectation was that after long observation these temporary exceptions would ultimately yield to the norm. And so it was that what remained unruly in the distribution of rain in space and time became the crucial object of analysis.
Working from records spanning more than one hundred years, Brückner found telling indications—neither rigorously uniform in duration nor in amplitude, but nonetheless notable in their number—of cycles with an average duration of about thirty-five years; indeed, the same time span (or “prime”) mentioned by Bacon. Yet Brückner’s plot of the time series yielded disturbing visual results. He notes, for instance, that “when temperature variations are placed along a graph, the result will be an irregularly shaped ‘zigzag’ line.” These were not nicely rounded cycles, and this outcome was not simply an artifact of faulty data collection. In The Combination of Observations (1917), meteorologist David Brunt addressed the Gaussian law of error, along with the theory of generalized frequency curves and new methods for investigating hidden periodicities. But his chief contribution to the discussion of climatic cycles was to attack the underlying assumption that nature works according to harmonic sine curves.[5] As statistician Maurice Kendall writes, “Nature does not seem to have studied the mathematical theory of harmonic analysis nearly so thoroughly as she ought.”[6] Perhaps the fault does lie in the stars.
How ought nature to operate? The 1884 publication of economist W. Stanley Jevons’s Investigations in Currency and Finance, particularly the chapter “The Solar Period and the Price of Corn,” in which he developed his famous “sunspot” theory of business cycles, amply stimulated the search for ever more occult correlations between celestial, terrestrial, and socio-economic data. The periodic variation of tropical harvests is connected with the solar period, Jevons claimed, and this harvest variation operates so as to determine the naturally rhythmic fluctuations of European trade.[7] Upon this literally far-flung reflex arc depended the fortunes of an empire on which, it was once said, the sun never sets. Jevons found one source of confirmation for his theories in physicist Arthur Schuster’s observation that the years of good vintage in Western Europe have occurred at intervals approximating eleven years, the average length of the principal sunspot cycle. Schuster, who innovated methods in the harmonic analysis of time series, had his own doubts. In his 1906 paper “On the Periodicities of Sunspots,” he called into question the “vogue” for correlations between solar and terrestrial phenomena. But it was the vogue itself, and its interpretive vagaries, and not the reality of periodic phenomena, that troubled him.
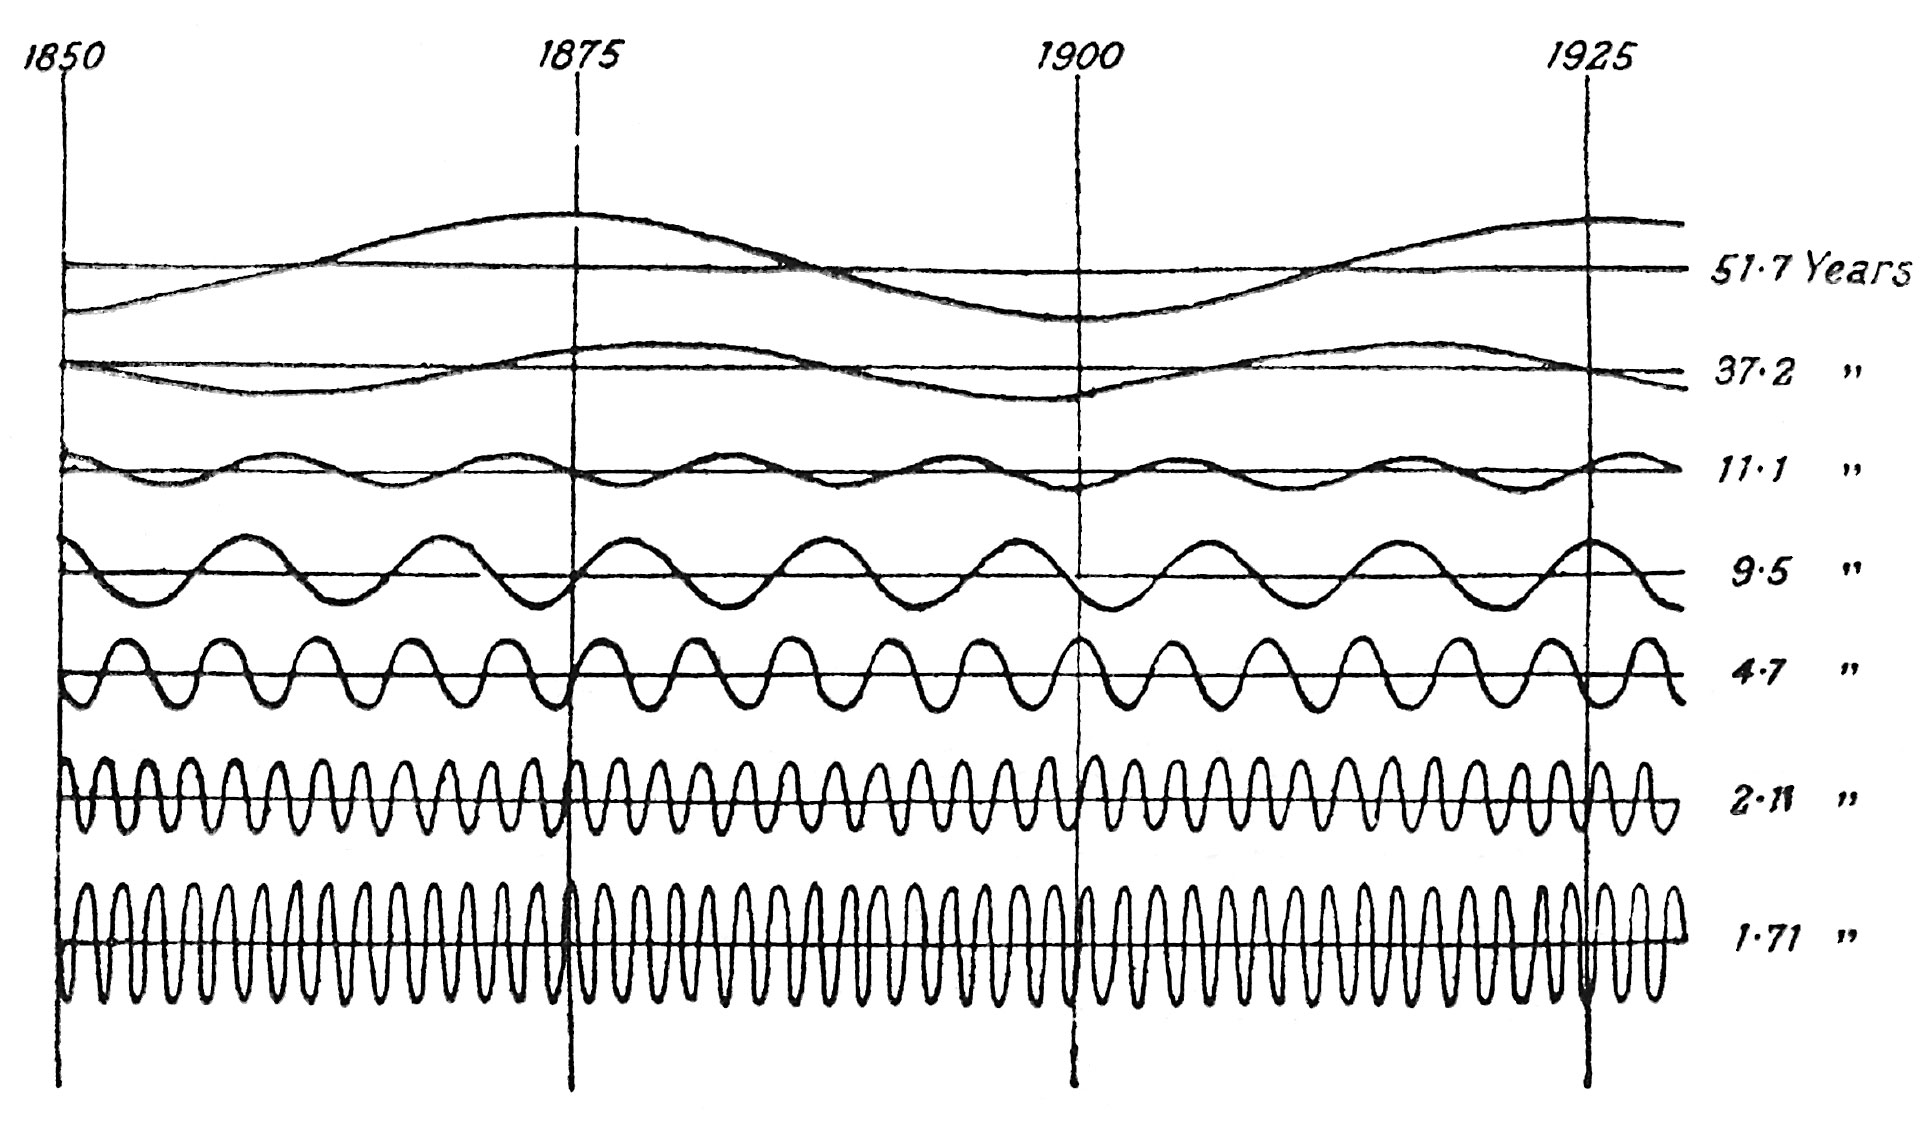
As Schuster readily admits, while his periodogram—a diagram representing the intensity of periodic variations—presents statistical information in a readily apprehendable form, there will always be cases in which “interpretation is difficult.”[8] The resulting curve represents the magnitude of any regular or irregular change in a time series. The difficulty of interpretation consists of winnowing true periodic changes from other variations, which during short periods of time “simulate periodicities.”[9] Such is the nature of simulation that the law-like appearance of “accidental” periods casts doubt upon the original attempt to detect oscillatory movements within observed time series. Schuster developed probabilistic models to filter the random elements, errors of observation, and statistical irrelevancies that were presumed to be superposed on the harmonic scheme (or, as one observer aptly put it, to separate the wheat from the chaff). For indeed, the most comprehensive application of Schuster’s method was Sir William Beveridge’s econometric study of 1922, “Crop Yields and Rainfall in Western Europe,” in which he claimed to reveal nineteen distinct cycles, with lengths ranging from 2.735 to 68 years, from a series of wheat price indices extending over three hundred years.[10]
Beveridge’s study is now best remembered for the example statistician George Udny Yule made of it in his 1926 paper, “Why Do We Sometimes Get Nonsense Correlations Between Time-Series?” Beveridge in fact anticipated some of Yule’s objections. Responding to criticism leveled by the improbably named Mr. Flux, Beveridge allowed, “I certainly do not wish to assert that the whole of the weather can be reduced to a series of cycles. The cycles which I have found may, I think, ultimately be found to account for 30 per cent., or 50 per cent., or possibly even 75 per cent. of the weather. … But I do not in the least know what this proportion is, and I know still less what may be the law governing the balance.”[11] As Yule saw it, however, the task was not to set the balance right, but to recognize the chaotic agency that held the balance in sway. The problem of periodogram analysis, according to Yule, was its “tendency to start from the initial hypothesis that the periodicities are masked solely by such more or less random superposed fluctuations—fluctuations which do not in any way disturb the steady course of the underlying periodic function or functions.”[12]
“Many series which have been or might be subjected to harmonic analysis,” Yule observed, “may be subject to ‘disturbance,’ and this may possibly be the source of some rather odd results which have been reached.” Beveridge’s analysis is here implied, as is Schuster’s work on sunspots, which Yule revisited in a paper of 1927 entitled “On a Method of Investigating Periodicities in Disturbed Series.” There, Yule sketches, not altogether whimsically, a thought-experiment on the nature and source of disturbance:
If we observe at short equal intervals of time the departures of a simple harmonic pendulum from its position of rest, errors of observation will cause fluctuations. … But by improvement of apparatus and automatic methods of recording, let us say, errors of observation are practically eliminated. The recording apparatus is left to itself, and unfortunately boys get into the room and start pelting the pendulum with peas, sometimes from one side and sometimes from the other. The motion is now affected, not by superposed fluctuations, but by true disturbance, and the effect on the graph will be of an entirely different kind.[13]
No doubt these were Alan Bennett’s redeemingly unruly history boys. “How do I define history?,” one of them asks, but not without prompting. “It’s just one fucking thing after another.”
marked a migration of “arithmetical manipulation“—as Sir Napier Shaw, longtime director of the Meteorological Office, approvingly described statistical methods of treating time-series—into the handling of the documentary sources of history.[15] But what cannot be discounted from the equation is the considerable extent to which the search for cycles was undertaken in the desire to “forecast the weather for long distances ahead.”[16] Thus we come to Collingwood’s prediction of what disturbances await the researcher.
“The historian who tries to forecast the future is like a tracker anxiously peering at a muddy road in order to descry the footsteps of the next person who is going to pass that way.” So Collingwood writes in an essay of 1927 entitled “Oswald Spengler and the Theory of Historical Cycles.”[17] To imagine the past, Collingwood asks the historian to look to the future, “the infinite well-spring of those events which, when they happen, become present, and whose traces left upon the present enable us to reconstruct them when they are past.”[18] Is it a muddy road, and not carefully drawn curves, that squishily connects the future and past? In “Who Killed John Doe?,” the detective story Collingwood included in The Idea of History, a sudden rainstorm provides a timeline with which to reconstruct the night of the crime. The absence of mud tracked into John Doe’s study exculpates Richard Roe, one of Detective-Inspector Jenkins’s likely suspects. For Maurice Kendall, writing of the pitfalls of detecting hidden periodic movements in economic, meteorological, and geophysical time-series, the chief suspect in any such mystery is the method of detection itself:
The plain fact is that an investigator into oscillations in time-series nowadays is very much in the position of the detective in the modern crime novel. By the time he arrives on the scene to inspect the corpse, so many feet have trampled all round it that he can easily find a footprint to fit any suspect he likes to choose. The main difference is that under the rules of criminal fiction the detective must not be the culprit. In the theory of time-series he frequently is.[19]So much for following the rules. The evidence is compromised. The methods are suspect. The only thing lacking is malicious intent.
In the thirteenth edition of An Introduction to the Theory of Statistics, Yule and Kendall cast doubt upon the final commensurability of things. They write, “Many people, in fact, have been led by their enthusiasm for numerical data to regard knowledge of a non-quantitative kind as hardly deserving the name ‘knowledge’ at all.” The implication is that they have been led astray down a straight path. The poet alone “coupleth the generall notion with the particuler example,” wrote Sidney. Is it possible Yule had a similar vocation in mind for the statistician? “When we find that a theoretical formula applied to a particular case gives results which common sense judges to be incorrect, it is generally as well to examine the particular assumptions from which it was deduced, and see which of them are inapplicable to the case in point.” Yule had the good sense to seek the order of things in the nature of disturbance. Sidney hazarded circumstance, bravely or foolishly it is not for us to say; what we do know, and that only very indistinctly, is the bare was of his demise in combat.
In his essay “Weather in War-Time,” Richard Bentley, President of the Royal Metereological Society, relates that during the Netherlands War of Independence, Elizabeth I sent troops under Robert Dudley, Earl of Leicester, Philip Sidney’s uncle, to aid the Dutch rebels. Leicester intercepted word that the Spanish were to send a relief column and supplies to the city of Zutphen. English troops under command of William Stanley and John Norris were stationed on the road to intercept the Spanish. On the morning of 22 September 1586, “there fell a great and thick mist that you might hardly see a man ten paces off,” under cover of which the enemy advanced. Suddenly the mist lifted, and the astonished Englishmen found themselves in the very teeth of an entrenched body of three thousand of the enemy. They charged, and Sidney’s horse was killed under him. He mounted another horse and joined in a second charge. Reinforcements galloped up and a third charge was made, during which Sidney received his death wound.[20]
Had Sidney seen further into the obscuring mist, perhaps things might have ended differently for him. But again, that is only for the poet to say. The historian is rather more constrained, for at best he might argue that “because it rained yesterday therefore it should rain to-day.” The past as prologue? And what of the long-term prospects of knowledge of the qualitative kind? Brooks and Glasspoole write that a large number of periodicities had recently been discovered, “but in this country at least they do not amount to a great deal.” Meteorologists were still a long way, in their estimation, from deriving reliable forecasts on periodic phenomena. Far from indulging in a conceit, these two custodians of the recorded history of rainfall were finally bemused by the dawning recognition that periodic phenomena “are not only small in comparison with the accidental or irregular variations; they are not even entirely regular and permanent.” Real and accidental periodicities coupleth in a most promiscuous way, and only seldom as future history foreordains they should. How bright the future might appear if only it could be uncoupled from our halting efforts to remake the past.
- Thomas Sprat, The History of the Royal-Society of London, For the Improving of Natural Knowledge (London: 1667), p. 115.
- Sir Philip Sidney, The Defence of Poesie (London: William Ponsonby, 1595), n.p.
- Hugh Robert Mill, “Introduction,” Rainfall Atlas of the British Isles (London: Royal Meteorological Society, 1926), p. 6.
- Alfred J. Henry, “The Brückner Cycle of Climatic Oscillations in the United States,” Annals of the Association of American Geographers, no. 17 (1927), p. 61.
- David Brunt, “Climatic Cycles,” The Geographical Journal, no. 89 (March 1937), p. 215.
- M. G. Kendall, “On the Analysis of Oscillatory Time-Series,” Journal of the Royal Statistical Society, no. 108 (1945), p. 96.
- W. Stanley Jevons, Investigations in Currency and Finance (London: Macmillan and Co. 1884), p. xxxiii.
- Arthur Schuster, “On Periodicities of Sunspots,” Philosophical Transactions of the Royal Society of London, no. 206 (1906), p. 71.
- Arthur Schuster, “On Sun-spot Periodicities—Preliminary Notice,” Proceedings of the Royal Society of London, no. 77 (1906), p. 141.
- William H. Beveridge, “Wheat Prices and Rainfall in Western Europe,” Journal of the Royal Statistical Society, no. 85 (1922), pp. 412–475.
- William H. Beveridge, “Supplementary Notes,” Journal of the Royal Statistical Society, no. 85 (1922), p. 475.
- George Udny Yule, “On a Method of Investigating Periodicities in Disturbed Series, with Special Reference to Wolfer’s Sunspot Numbers,” Philosophical Transactions of the Royal Society of London, no. 226 (1927), p. 268.
- Ibid.
- Brunt, “Climatic Cycles,” op. cit., p. 225.
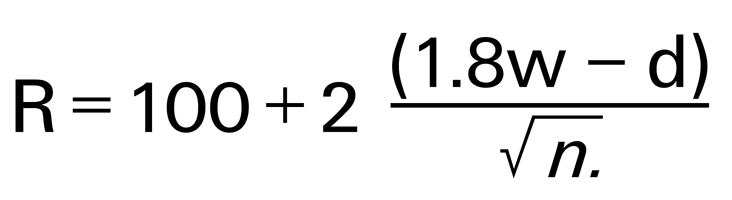
- C. E. P. Brooks & J. Glasspoole, British Floods and Droughts (London: Ernest Benn Limited, 1928), p. 191, where R is raininess, d droughts, w wet years, and n the number of meteorological records. Sir Napier Shaw, Manual of Meteorology (Cambridge: Cambridge University Press, 1926), vol. I, p. 254.
- David Brunt, “Periodicities in European Weather,” Philosophical Transactions of the Royal Society of London, no. 225 (1926), p. 247.
- R. G. Collingwood, “Oswald Spengler and the Theory of Historical Cycles,” Antiquity, no. 1 (1927), p. 320.
- Ibid.
- Kendall, “On the Analysis of Oscillatory Time-Series,” op. cit., p. 58.
- Richard Bentley, “Weather in War-Time,” Quarterly Journal of the Royal Meteorological Society, no. 142 (April 1907), p. 104.
Edward Eigen is assistant professor at the Princeton University School of Architecture. His forthcoming book, The Anomalous Plan, examines the architecture and geography of nineteenth-century French science, with specific reference to experimental laboratories. He is currently planning a conference on the history of accident.
Spotted an error? Email us at corrections at cabinetmagazine dot org.
If you’ve enjoyed the free articles that we offer on our site, please consider subscribing to our nonprofit magazine. You get twelve online issues and unlimited access to all our archives.