Blocking All Lanes
Sig-Alerts, detection loops, and the management of traffic
Sean Dockray, Steve Rowell, and Fiona Whitton
The word traffic is always a little slippery, one of those words that escapes us when we try to pin it down. When engineers say traffic, they mean the movement of vehicles along a roadway, or what you’d find if you consulted a dictionary. For the rest of us civilians, however, traffic has come to mean the exact opposite: that phenomenon of vehicles crowding a roadway until everything slows down to a frustrating crawl.
Roughly ten years and four hundred thousand automobiles into the twentieth century, the phenomenon was given its own name by the Saturday Evening Post: the traffic jam. While this seems quaint to a driver accustomed to four-hour-long rush hours, engineers continue to categorize it as “traffic congestion” even if there’s no consensus on what that means. Is it slowness at a point over time—or over an area at a point in time? If so, how slow? Or maybe it’s just a feeling? In cities all over the world, congestion is becoming the rule, which is to say that it is simply becoming “traffic.”
The word traffic originally referred to the movement of commodities; only in the last two centuries did it explicitly take on vehicles and people. In the modern definition, we are traffic (which reminds us that it was once quite acceptable for one to be a “computer” or a “typewriter”[1]). Of course, we don’t talk that way: we say that we are “in traffic,” but we never admit to being traffic. This point was made into a German roadside ad campaign (“You’re not stuck in a traffic jam. You are the traffic jam.”[2]), but it hasn’t found traction in our speech.
Our attachment to the preposition is an expression of our profound ambivalence to driving. The automobile, the capitalist vehicle par excellence, promises freedom while the often frustrating experience of driving leaves us feeling quite out of control. We hold onto the idea that although we might be stuck now, there is a way out. But what if our agency was underpinned by an organizing, computational mechanism? We stop. We go. We turn. We yield. What if these were not simply rules to follow (code as law), but instructions to follow (code as program), an instruction that gives a green light?
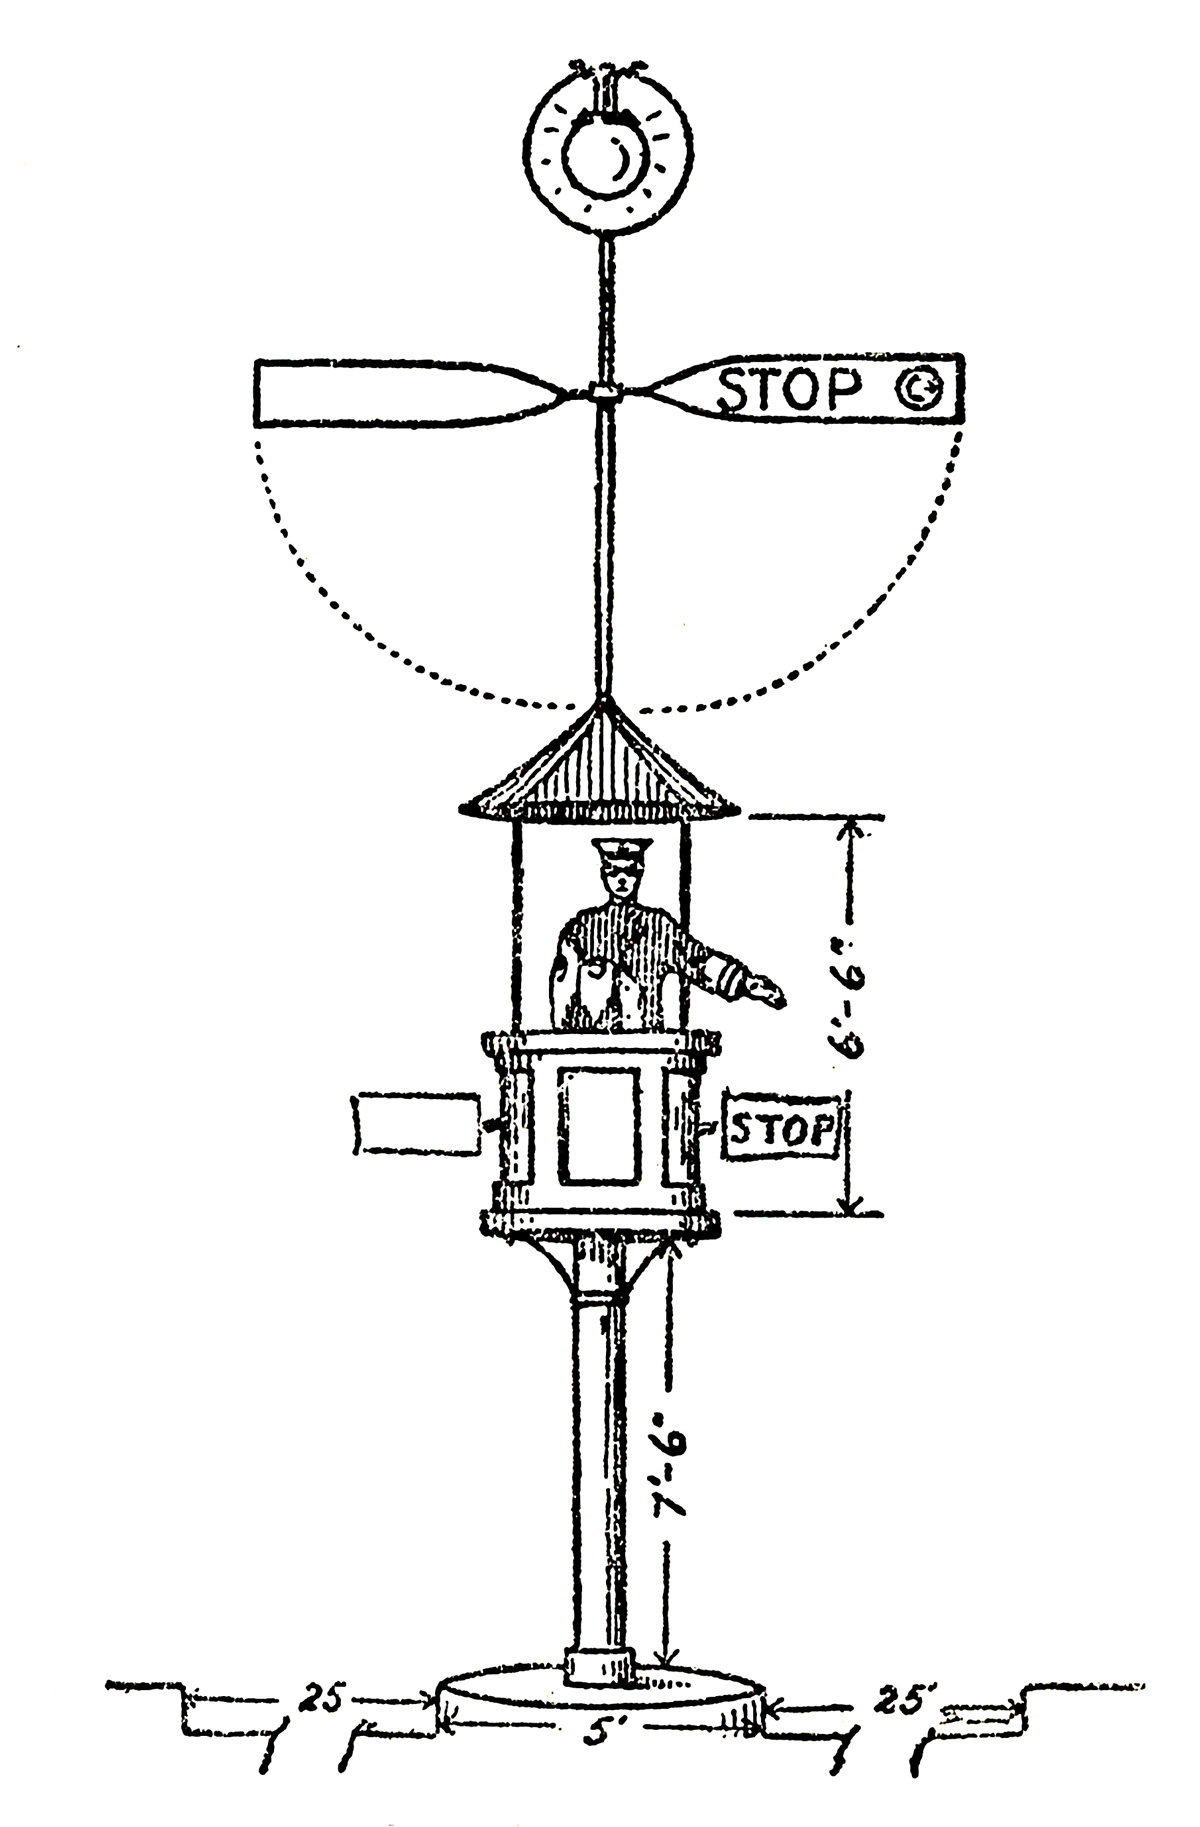
Beginning in 1860, New York City’s police department was given the task of regulating the increasingly competitive and reckless drivers of horse-drawn buses. Not long before, the City Council had given permission for the livery corporations to franchise, and many pedestrians were killed in the aftermath as drivers raced each other to their destinations. The police officers who brought order to the streets were not ordinary men: they were some of the tallest on the force (“Broadway’s Finest” were all over six feet tall) so that they could be seen above the confusion of carriages and pedestrians, and they would point and wave, moving traffic with their hands, and shouting through it all to eliminate uncertainty.
It is the policeman who marks the origin of modern traffic control. He represents a system of rules and enforces them, apprehending violators. But he does more than this—he also directs the traffic and his professional presence keeps traffic from degenerating into a stall. As Burton Marsh wrote in 1927, “The officer can take advantage of variations in the volume of traffic on the two streets and give to each street that proportion of time best suited to it at that minute.”[4] In the beginning, each officer was a responsive, real-time traffic control system.
There were problems with this immediately. It was difficult enough for any single officer to coordinate his activities with another officer, one block away. But it was practically impossible for that officer to work with officers at the four adjoining intersections, each of whom might be coordinating with three more intersections, and so on, throughout the urban grid. Over time, the traffic cop was slowly transformed: his hands took on white gloves for visibility; his voice was replaced by a whistle; eventually, he was elevated in a tower and communicated with the traffic via signs or colored lights. The police officer slowly vanished, his body evolving into mechanical and electrical devices. His hands were replaced by standardized, colored signals. His eyes were replaced by sensing actuators, such as microphones, pressure sensors, electromagnets, or video cameras. All that was left was to replace his brain.
A very early experiment with non-human control occurred in London in 1868. There, the first ever traffic signal using colored lights was installed at a busy intersection near the Houses of Parliament. These gas-powered semaphores attracted throngs of Londoners, and merchants, selling food and drinks, rounded off the spectacle. Part of the intrigue of this sort of innovation was the premise that a machine could do some aspect of the policeman’s job. These sorts of innovations proliferated in the 1920s, during which time most regulated intersections were equipped with discrete signals. William Phelps Eno, “Father of Traffic Safety,” and author of New York’s first printed traffic regulations in 1903, wrote a quarter-century later that “students of traffic are beginning to realize the false economy of mechanically controlled traffic, and hand work by trained officers will again prevail.”[5] This nostalgic error was by no means unusual—it was said that the police officer could handle traffic “in a way which no mechanical device could do ... often being able to ‘weave’ it through the traffic from the opposite direction without entirely stopping either line.”[6]
In spite of these reservations, the technological development towards automated traffic control accelerated. The explosion of automobile use in the first two decades of the twentieth century put an unusually large strain on police departments in major metropolitan areas. Until the early 1920s, traffic control, even in its most advanced forms, had been a series of independent installations—traffic signal systems had not yet been born. In New York and Detroit, officers positioned in a series of traffic towers synchronized with one another to allow automobiles to flow freely in one direction. Houston built this logic into a string of electronically interconnected signals in 1922. The police officer was practically unnecessary in such an automatic, “simultaneous system.”
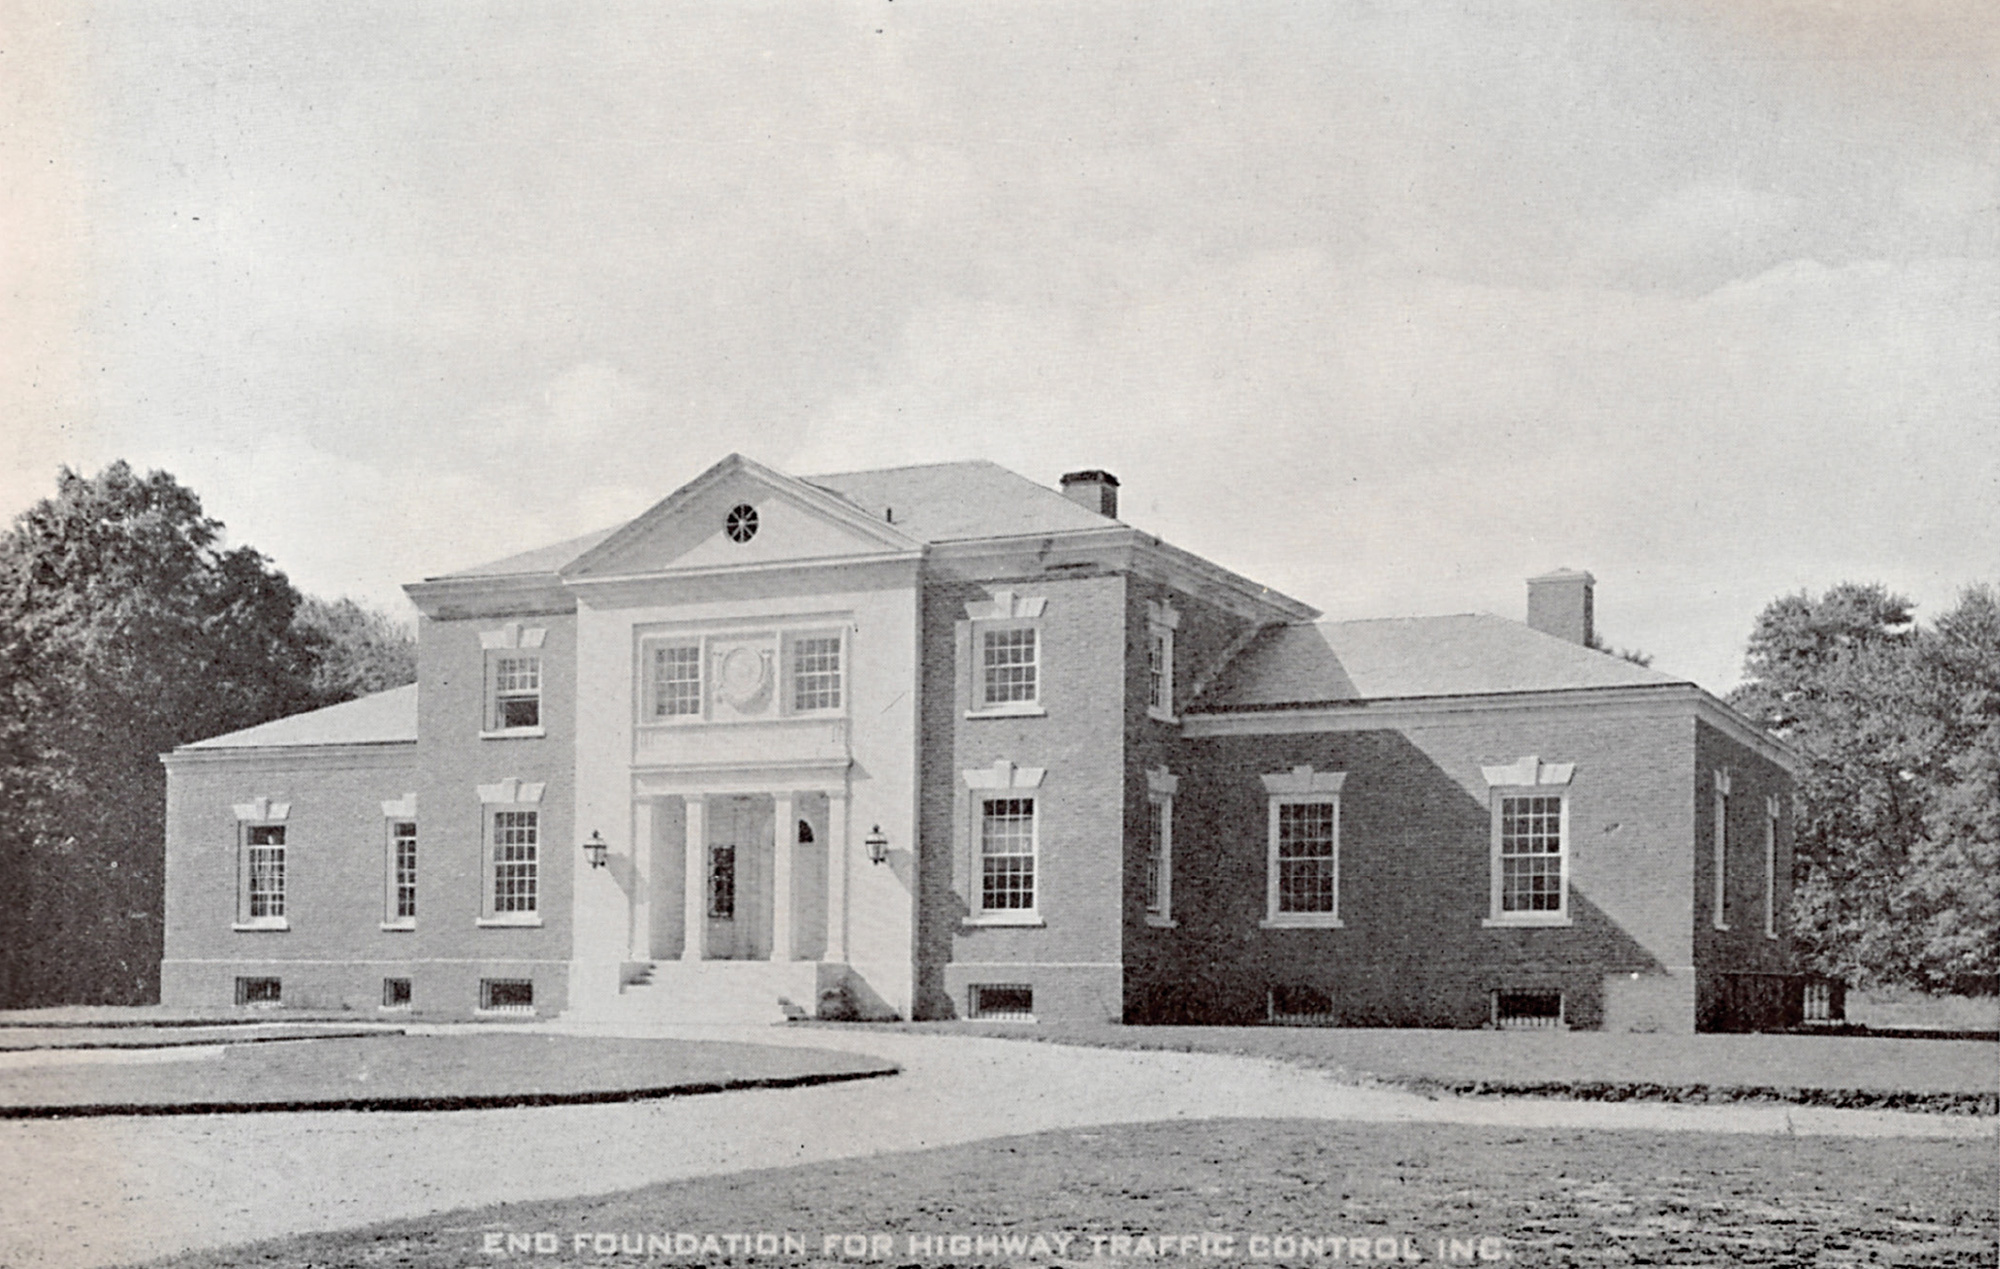
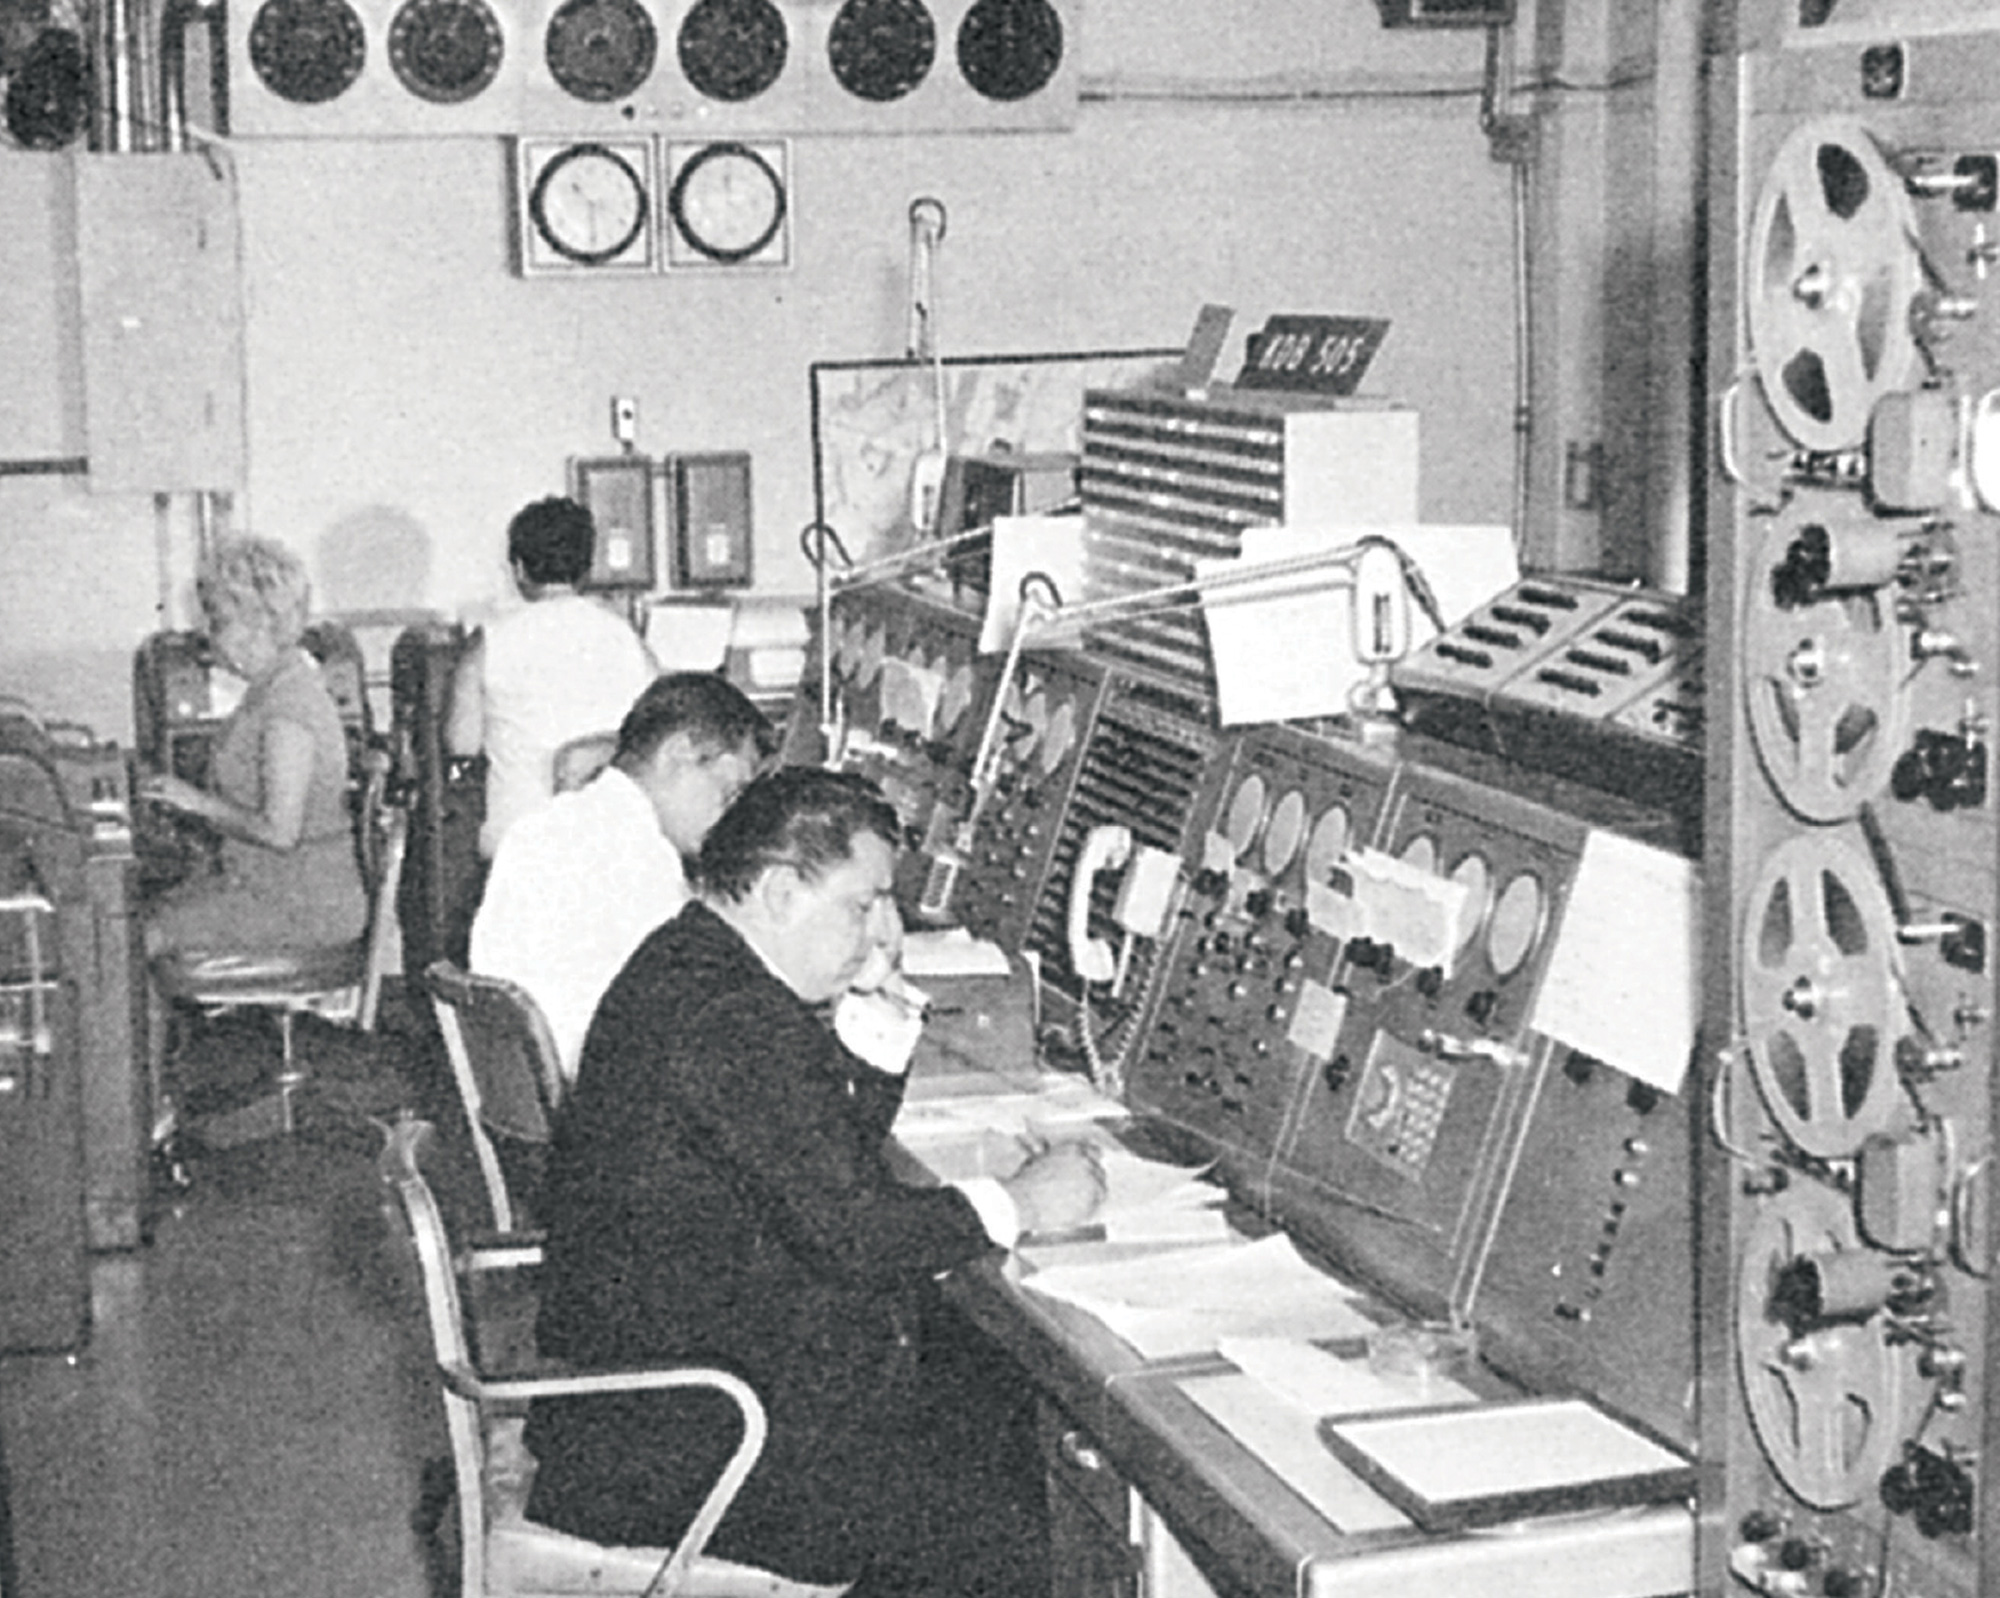
Once envied for its vast, efficient freeway system, Los Angeles eventually became the smoggy symbol of destructive automobile dependence and gridlock. Both images, however, are outdated. With one of the earliest and now most extensive traffic management systems, LA has become paradigmatic for “intelligent” urban traffic control worldwide. The Los Angeles district of the California Department of Transportation (CALTRANS) operates a traffic management center (TMC) in a fortified building, blocks away from the ATSAC center. ATSAC & CALTRANS combine with the Los Angeles County Public Works TMC to handle traffic flow throughout the region.
Examining Los Angeles further as a case study in both traffic and traffic management, we find a feedback loop between the environment and the system: the environment can be described as the collective movement of vehicles across the urban grid; the system is the infrastructure designed to measure, monitor, and control the environment. More specifically, the system in Los Angeles has two primary realms: the physical and the virtual.
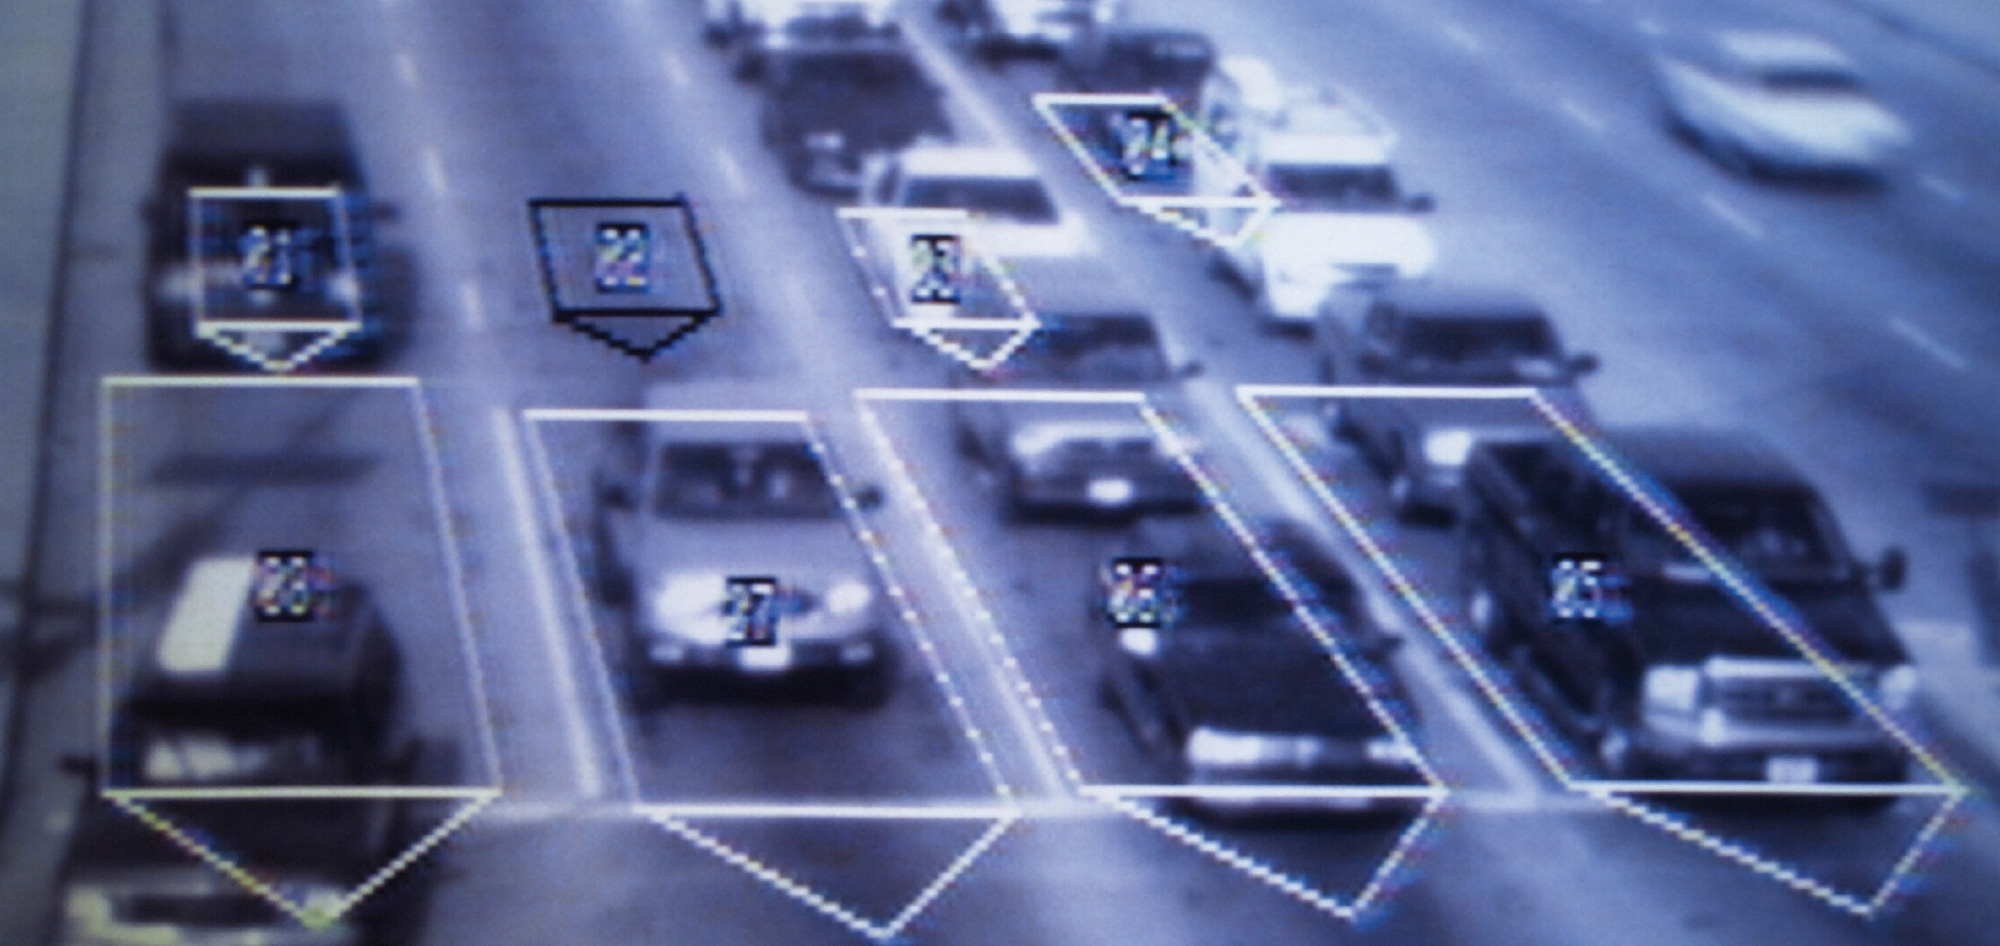
In the physical realm, over fifty thousand buried loop detectors, the insulated wire loops that passively detect subtle magnetic field changes from vehicles, combine with over seven hundred weatherproofed video cameras, some of which are remotely controlled to pan and zoom, to monitor and control traffic flow. Loops automatically trigger software in switching boxes linked to intersection signals, but also send data to TMCs that allow traffic engineers to monitor flow patterns and adjust timings remotely. A simple click of a mouse button can start or stop the flow of movement on the grid.
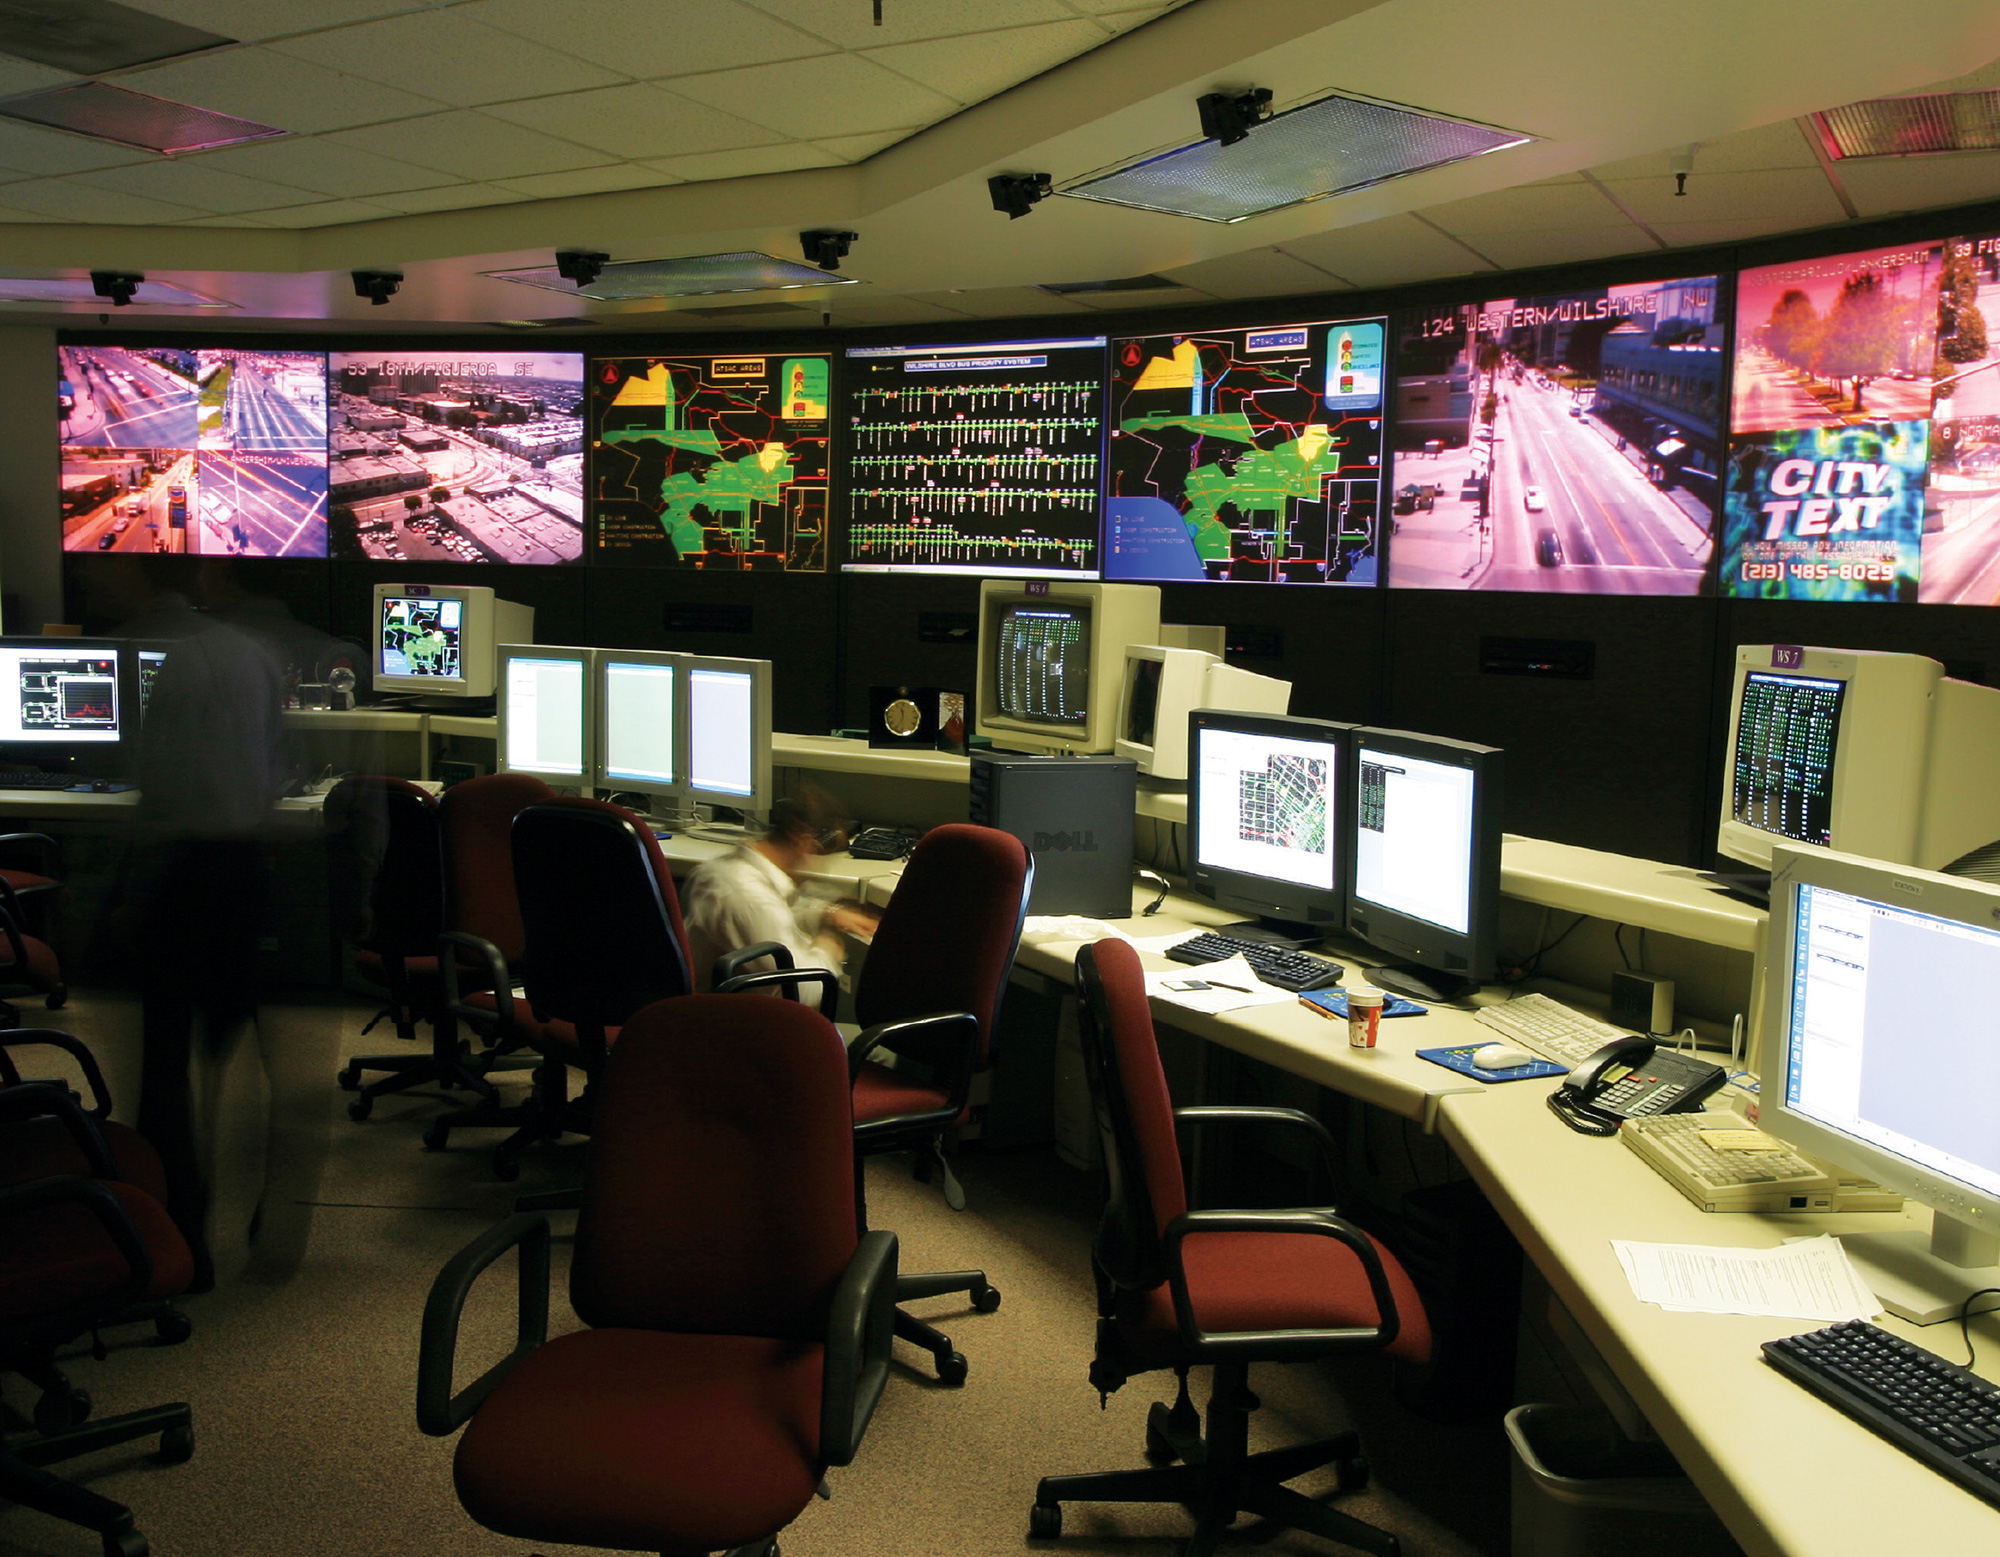
The surveillance power of 700 cameras seems oppressive, but neither CALTRANS, which controls 250 freeway cameras, nor ATSAC, which controls 350 street cameras, are allowed to archive footage or to feed a single frame of video to the Los Angeles Police force. Apparently, privacy concerns outweigh the value of surveillance on this scale. Aside from monitoring, an increasing number of these cameras can actually control traffic flow through sophisticated software interfaces. As vehicles pass in designated zones of the frame, they are counted and measured for speed and direction. The policeman and the loop detector are replaced.
When the controller “receives” and “assigns,” it does so from a distance: through buried phone lines, ethernet, microwaves, or whatever communication technologies are available at the time. Data circulates incessantly through these connections, animating the devices. It is as much a part of the story of traffic control as the hardware, but it is ephemeral and dynamic, useful only in the present. As new data supplants old data, the old fades into obsolescence, inscribed only in the strange memory of traffic patterns.
Some of this data is disseminated through the Internet to the public, so that motorists can make adjustments based on current traffic conditions and by intercepting this feedback of information, we have been able to collect the data before it is deleted and lost forever. In this data, one experiences the elastic city through abbreviated narratives of minor mishaps, inexplicable slowdowns, and tragedy.
The four diagrams that accompany this essay represent part of Los Angeles on Friday, 11 June 2004, the day of Ronald Reagan’s funeral. Ever since Lincoln’s body was preserved by the—then unconventional—process of embalming, presidential funerals have taken full advantage of the nation’s transportation infrastructure. After beginning the day in a ceremonial horse-drawn caisson in Washington, DC, Reagan was flown from Andrews Air Force Base to Point Mugu Naval Air Station in California, and then taken by motorcade to his namesake library for burial. As the motorcade headed east on the 101 at the tail end of rush hour, crowds along the route waved flags, and traffic going west came to a halt.
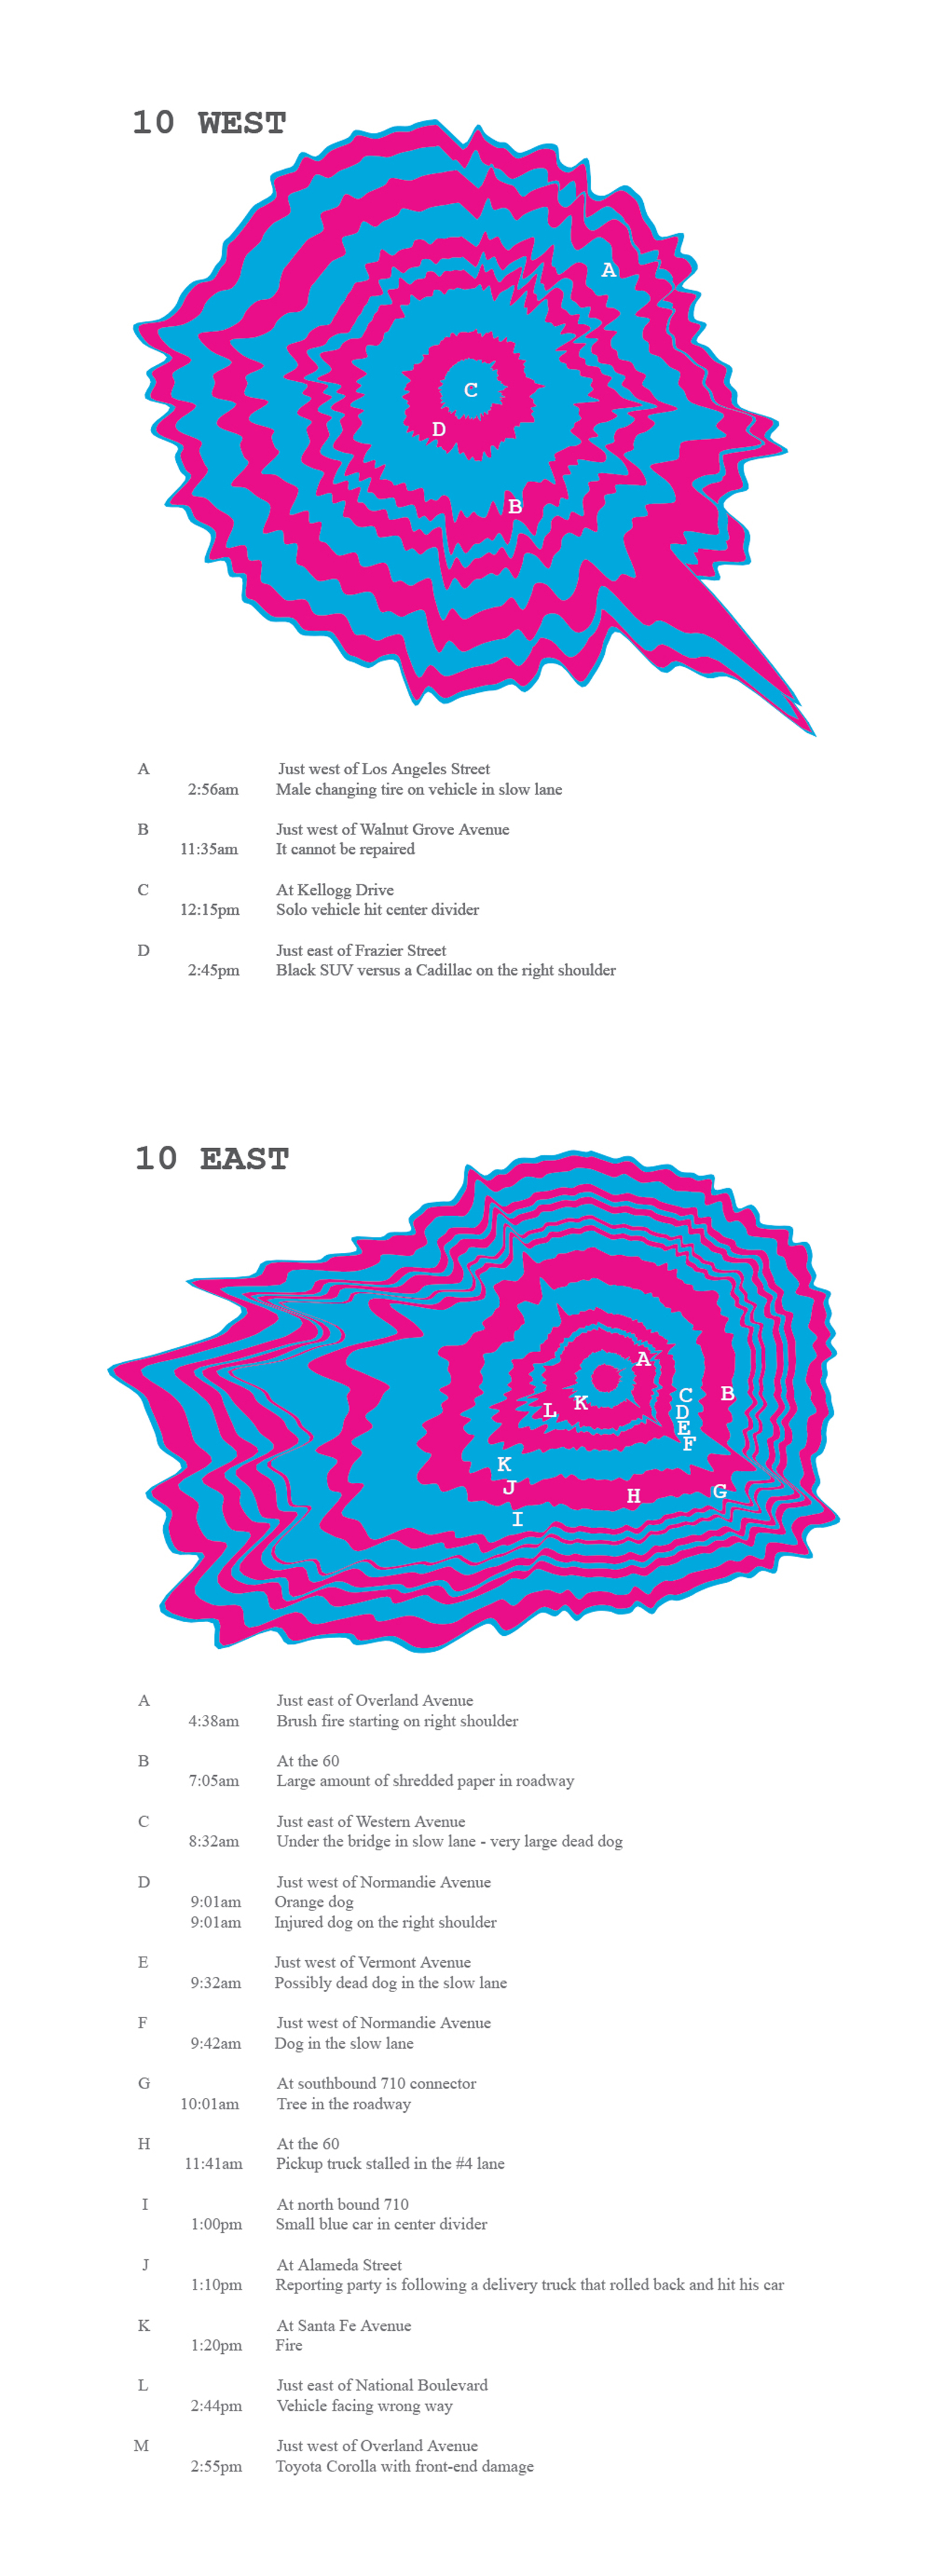
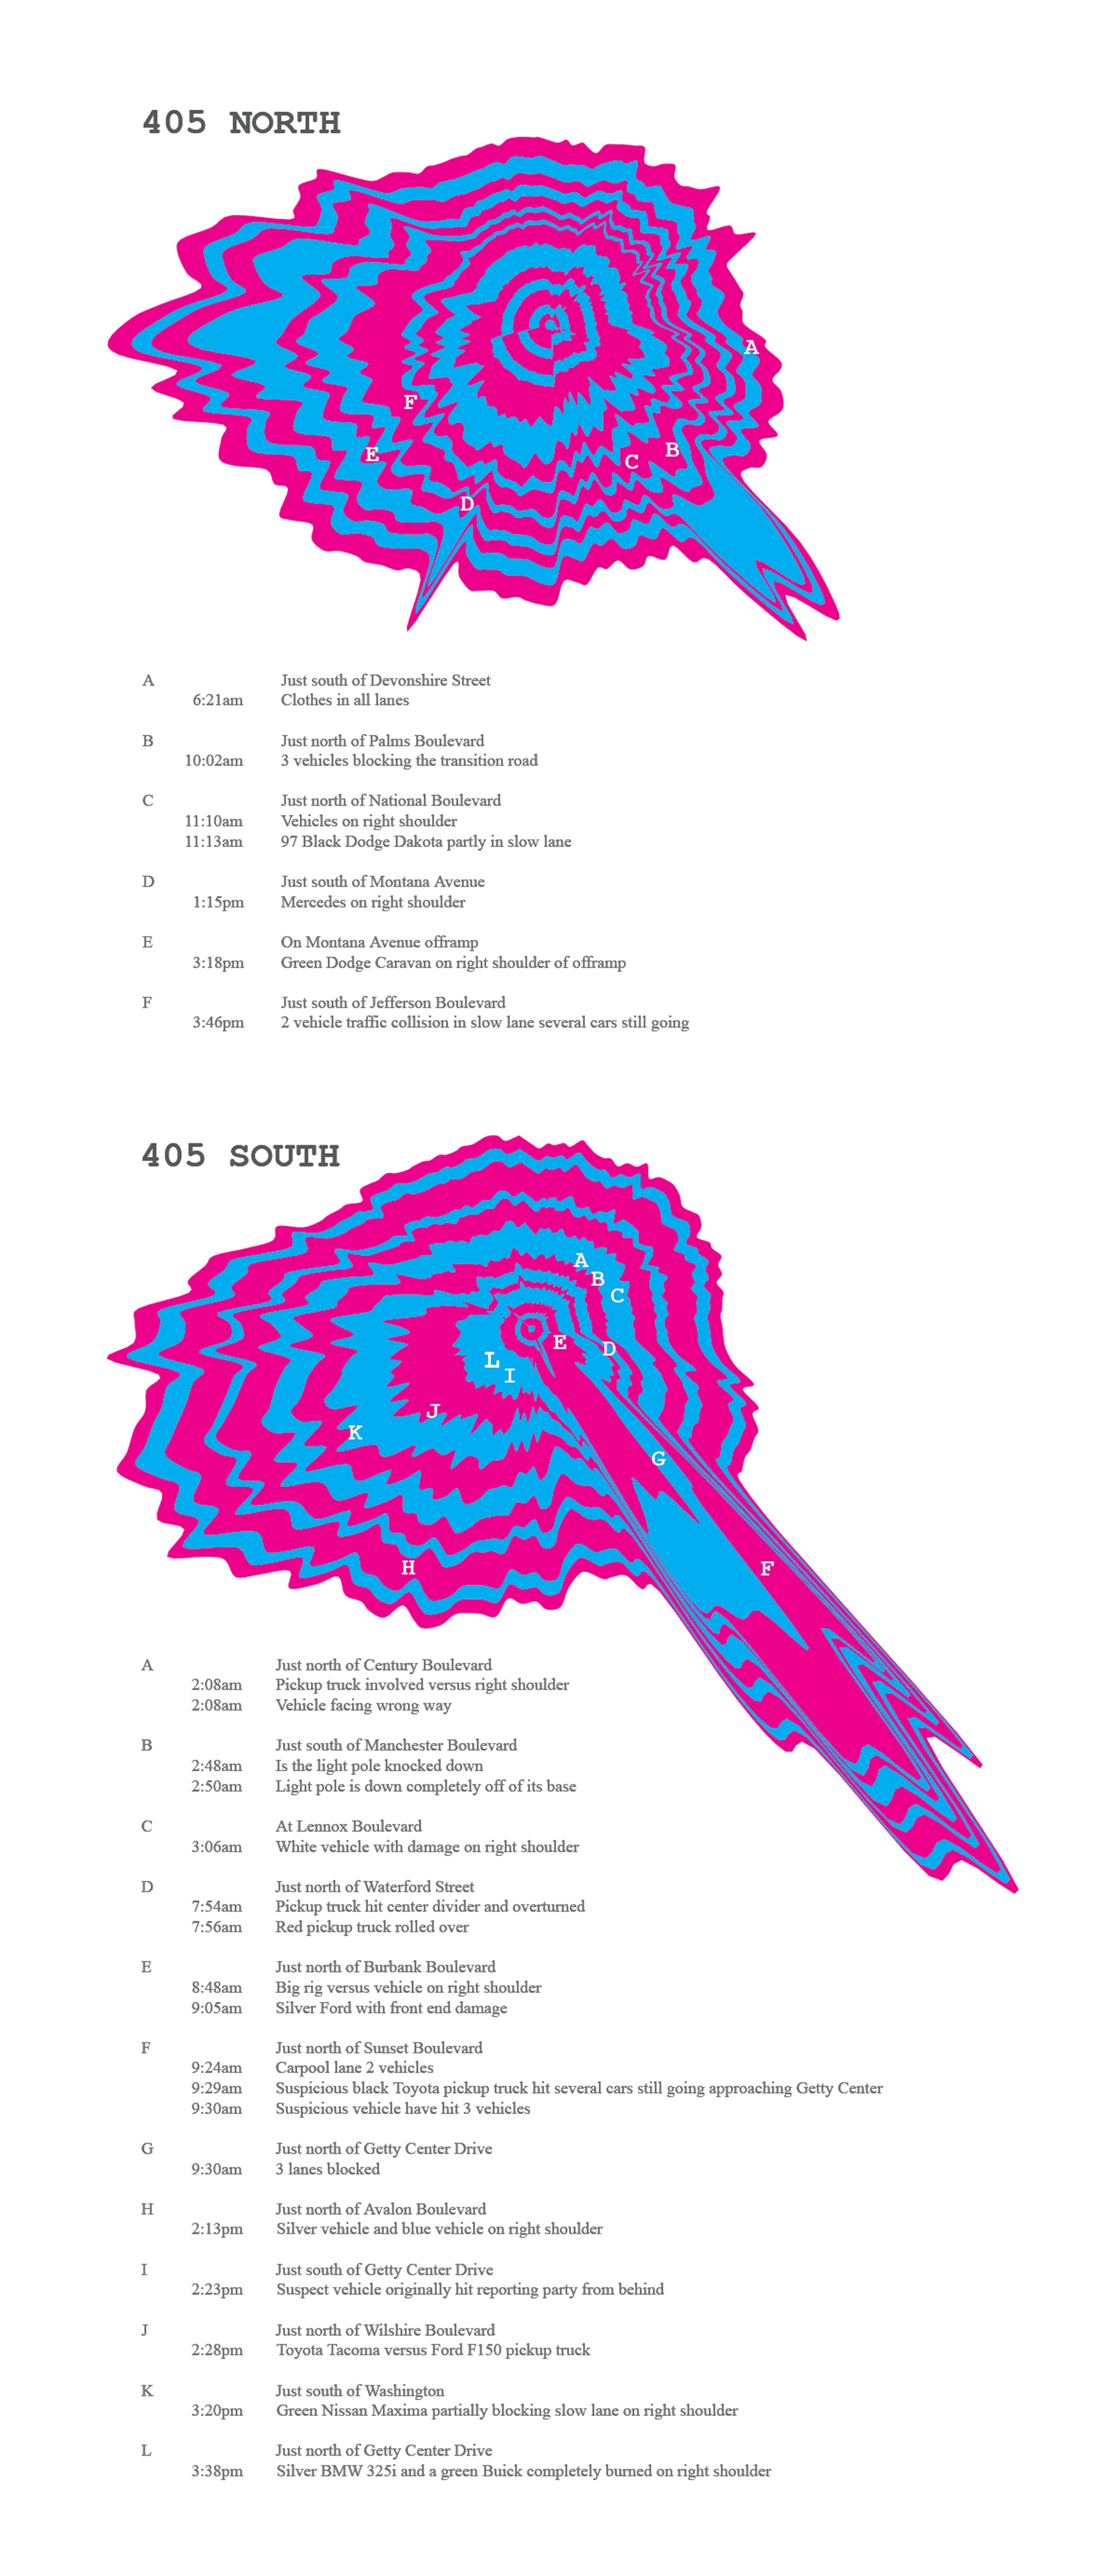
There is one diagram for each direction of two Los Angeles freeways. The center corresponds to one end of the freeway and the outer edge to the other—the distance between them corresponds to the amount of time required to drive from one to the other. As one traces the shape clockwise, from top to bottom, one passes from midnight to noon. Continuing from the bottom, up along the left edge, and back to the top, one passes from noon to the following midnight. A perfect day would be a set of concentric circles; as traffic builds, however, the circles deform outwards. Beneath each diagram are the “incidents” that occurred over the course of the day.[8]
Traffic, unlike weather and the stock market, is a complex system without a popular visual representation that would allow it to be remembered and internally differentiated. What is the analogy to the swirling radar image of a hurricane cloud or the plunging graph of a market crash? How can one day’s traffic be distinguished from another’s? The traditional topographical map of Los Angeles is radically divorced from each motorist’s perception of it, expanding and contracting over time. These diagrams provide an alternative way of imagining the city, centered at an individual point—a person at an origin—and outwardly directed to any number of destinations.
Of the three complex, chaotic systems, traffic is one that exists at the human, bodily scale, which is perhaps why it is so fascinating for us. We built the roads; we created its rules; we drive the vehicles, and yet it remains an inaccessible mystery. As the possibilities for adding highways (or even lanes) dwindle in many cities, most progress is made at the level of code (both legislative and software-related). To put off the inevitable stall, a truly monumental traffic jam, we incrementally transfer agency to optimizing algorithms. But still, in the heart of the rational system, there is the incessant irrationality of human behavior, the imprecision of reflex, and a perpetual reappearance of chance.
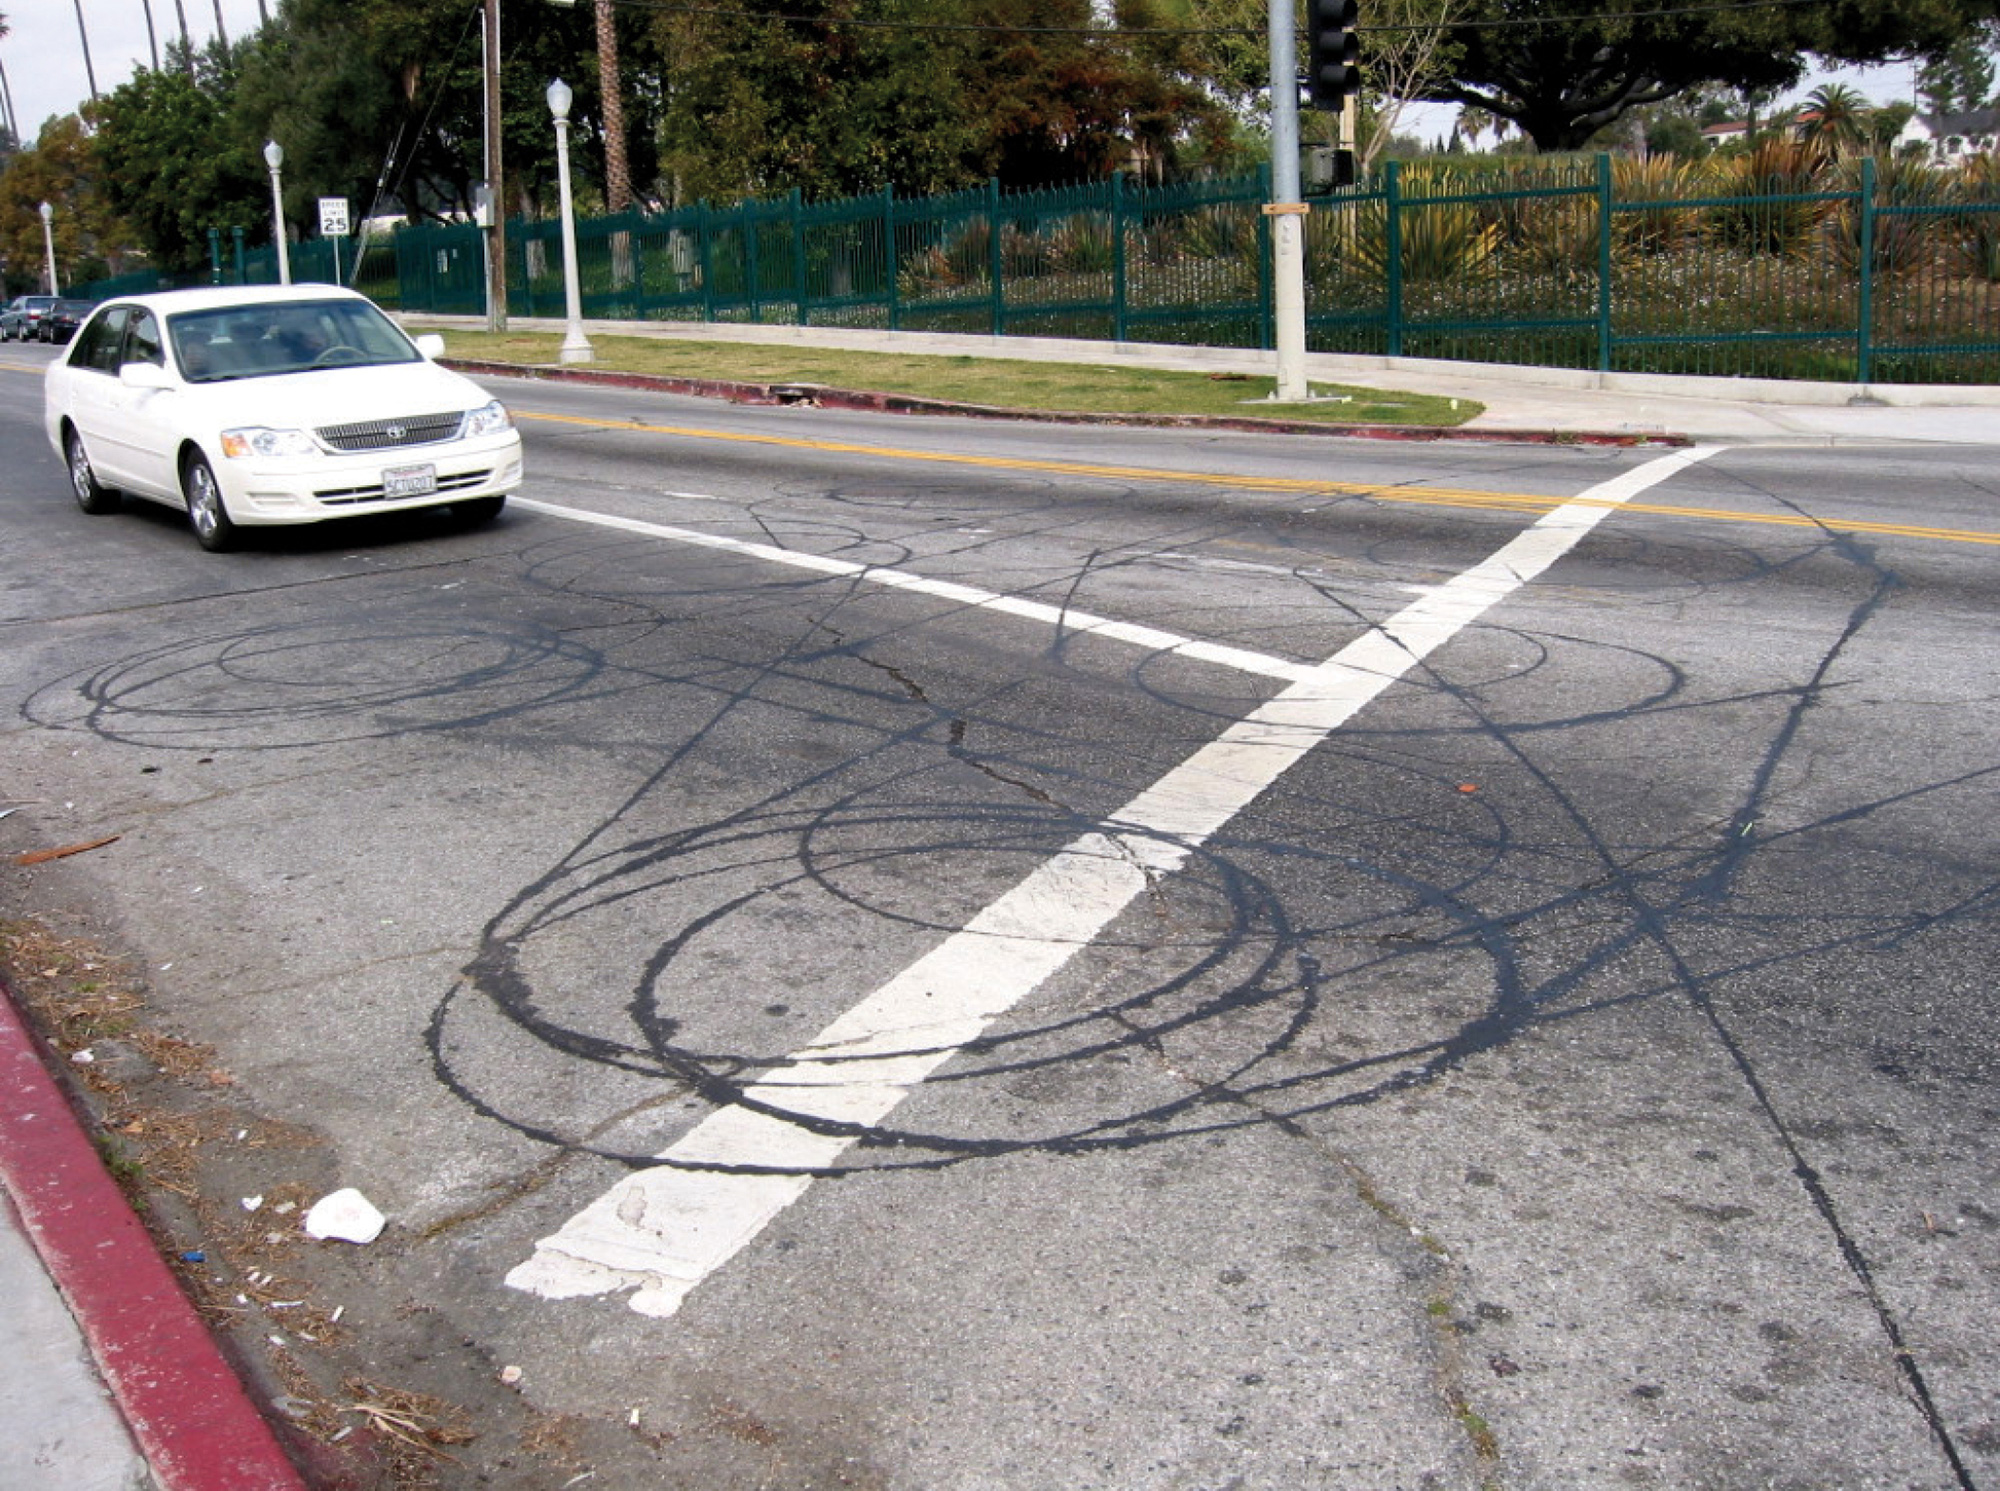
When traffic incidents occur, the system acknowledges and responds in various ways depending on the technological level of the area’s infrastructure. In the case of most freeways or major intersections in the city itself, cameras are the first observers, recording the collision or obstruction and the immediate effect on the surrounding flow. An extreme incident is known as a Sig-Alert and is defined by the California Highway Patrol as “any unplanned event that causes the closing of one lane of traffic for thirty minutes or more, as opposed to a planned event like road construction, which is planned separately,” and is named after Loyd C. “Sig” Sigmon. Mr. Sigmon developed a customized radio receiver and tape recorder that would detect a particular tone and record the bulletin, providing radio announcers with an analogue database of recent traffic incidents. This relieved dispatch from answering phone calls from the press. The first use of this device was in 1955 when doctors and nurses were requested to respond to a train derailment outside the Los Angeles Union Station. A traffic jam was the unintended result. It’s oddly appropriate that Mr. Sigmon was to pass away only days before President Reagan’s postmortem journey from a Santa Monica funeral home to Simi Valley, north of Los Angeles, shutting down miles of the busiest stretch of freeway in the country (the 405), causing multiple Sig-Alerts in surrounding areas.
Most incidents are accidents, meaning that they are unplanned events occurring without control by parties involved. Incidents also include planned events that interfere with the flow to the driver’s dismay. Hollywood production companies close entire blocks in downtown Los Angeles, affecting not only immediate parking and routing, but entire flow patterns if crucial one-ways are blocked. Detour routes can send drivers into unknown areas of the drastically divided downtown sectors. Construction crews and LAPD officers interact with convention guests, who are pitted against jaywalking pedestrians in skid row between the business districts and Little Tokyo; commuters, exiting the freeway to avoid a fuel spill, are routed to avoid rigging trucks and make-up trailers through throngs of Lakers’ fans in front of the Staples Center, causing confusion and compounding delays.
During the course of incident response, field units and management centers continue working until the blockage is removed, the disruption relieved, and steady flow reinstated. Dispatch relays information via voice and text messaging to units in the field. The same infrastructure used to monitor traffic patterns is put into use here. People do talk to people to report incidents and route response crews, but, increasingly, data is streamed and automatically routed and detected by devices on the grid—the computers autonomously interacting before relaying information to their masters. Responders typically communicate with management centers during the course of an incident, providing greater detail for a report, and enriching the potential narrative by providing an interaction of code. This code is intercepted by the public in many ways: through radio traffic reports and scanners, Internet traffic sites, and via real-time monitoring on consumer-grade GPS-enabled mobile gadgets. Compelling to the public observer, this new, truncated vocabulary is assimilated into the vernacular.
This is an example of an email alert dynamically issued from sigalert.com:
10:56 AM 405 South Before Getty Center Dr / Possible Fatality
10:56 AM 4 Vhs and Motorcycle Blocking #1, 2 and 3 Lanes
11:02 AM Car Pool, #1, 2 Lane is Blocked—Please Issue Sigalert
11:02 AM Rider Hit Possible By a Taxi That is Still On Scene
11:03 AM Transportation Management Center Copies Message/Item Delivered Media and Chiefs
11:08 AM Per 64 Says the #1, 2 Lanes Blocked on the North Lanes of the 405—Please Update the Sigalrt
11:12 AM Per S3 the Body is Blocking the North Lanes of the 405 Freeway[9]
On neighborhood streets or on remote stretches of highway outside of the reach of the system’s network, visual reporting by a passerby with a cellphone is the only immediate link. The California Highway Patrol’s website provides the public with the raw data:
Location: BARSTOW
7:08 AM SIL NISS 4D SPUN OUT TO R/S INTO DESERT[10]
Location: SAN BERNARDINO
7:58 PM AUTO VS COMMUNITY MAILBOX. PIECES OF MAIL EVERYWHERE[11]
Engineers take note of the calls or the camera feeds and speed graphs and notify the appropriate dispatch offices of the police, highway patrol, fire, public works, and/or animal response team. Extreme incidents might involve ATF or the National Guard. Incidents involving spills and animals call for less drastic action, but are still a constant problem and become an element in the feedback loop.
7:37 AM GREEN TOMATOS, OR GRAPES, SPILLED ACROSS THE ROAD
8:03 AM NEED SAND FOR 200 YARDS OF SPILL
8:03 AM NOTIFY CALTRANS, GRAPES AND GRAPE JUICE, IN BOTH LANES
8:05 AM Incident: 0350 Type: Traffic Hazard—Animal Location: 3604 N FERNDALE AV Zoom Map: 547 7B Info as of: 7/31/2004 8:13:20 AM
ADDITIONAL DETAILS:
8:05 AM 1144 CAT IN THE ROAD
8:05 AM KIDS ARE IN THE ROAD TO LOOK AT THE CAT[12]
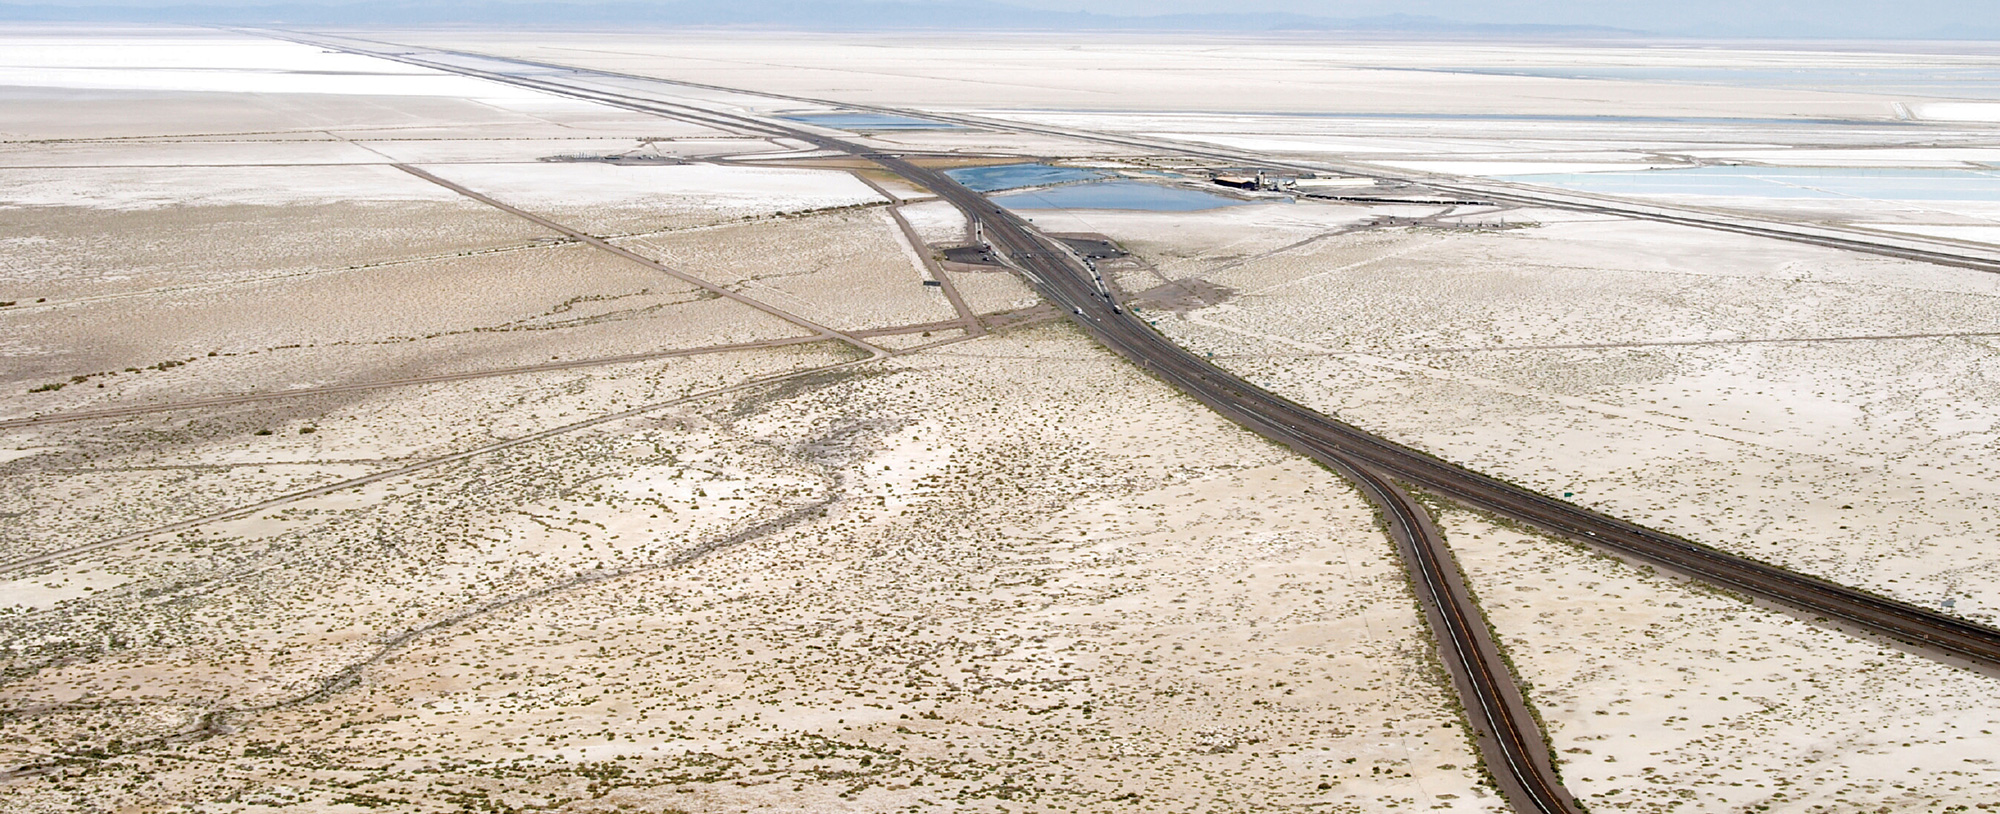
Still, commuters find openings in the traffic system. Engineers at ATSAC—and who would know better?—move to outlying cities and customize their work schedule around unusual commute times. Some have stopped driving and rely on underfunded public transportation, while others drive motorcycles between lanes in a refusal to participate. But the population of the Los Angeles area grows, the openings become fewer, and motorists dream of escape. For Los Angelenos, the Mojave Desert to the north and east provides a blank canvas for the traffic-weary driver. If the steep and narrow passes can be navigated, escape velocity is possible. As an analogue to subatomic particles hurtling away from a densely packed nucleus, energy is scattered as each vehicle spins from the city in limitless directions into this void. Where there is no grid, there should be no gridlock.
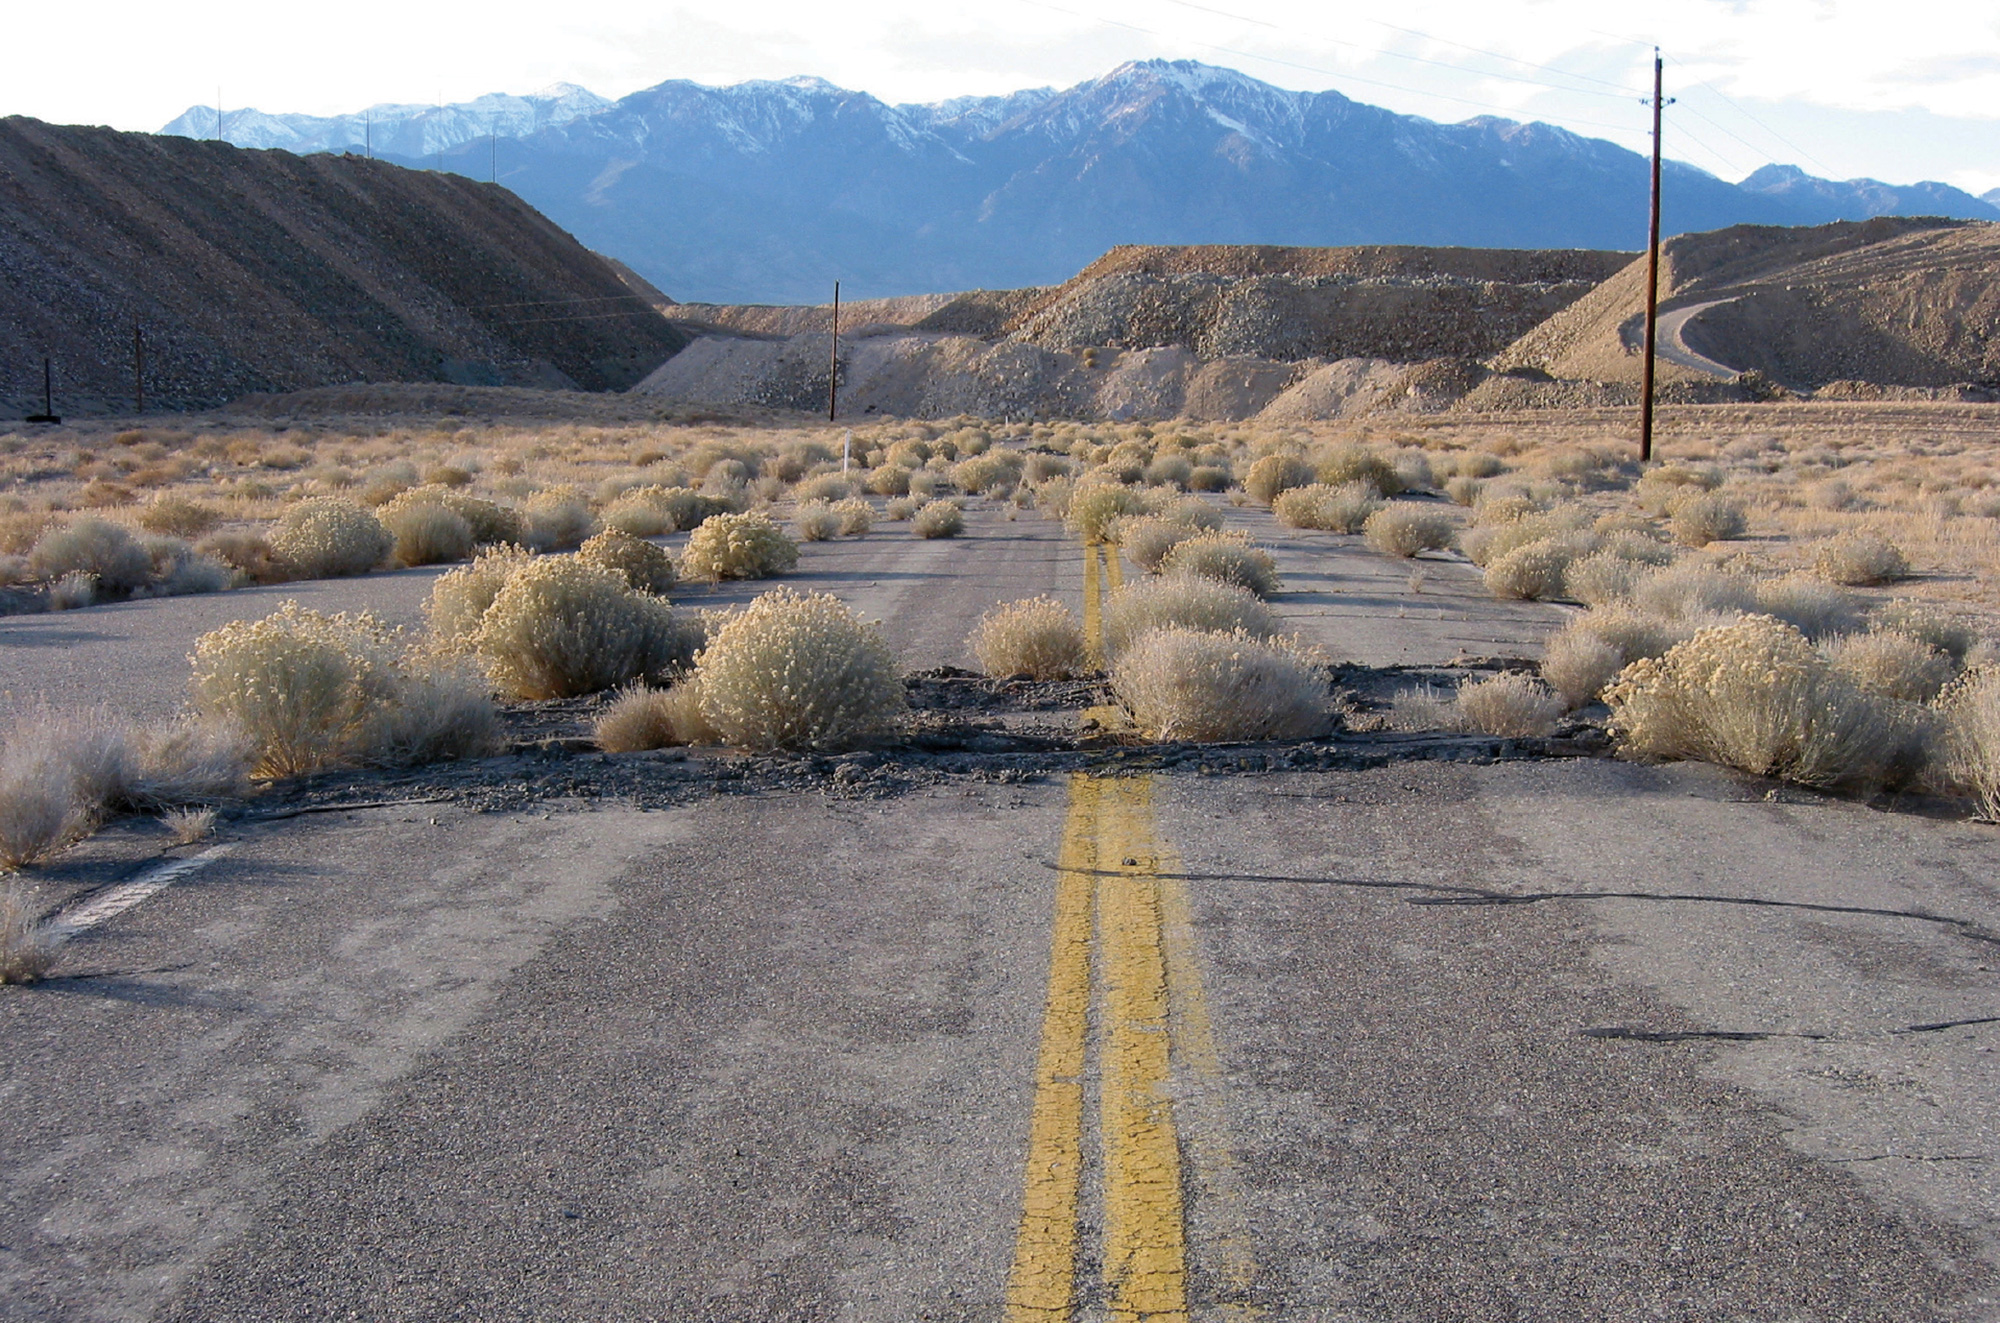
There will certainly be a time when maintenance ceases and detection loops short-circuit, cameras rust, signal lights burn out, and the asphalt cracks and splinters at its edges, the roads becoming overgrown with weeds. One can’t help but wonder where we will be when the traffic system sinks back into the earth’s geology.
Some elements of this article appeared in the exhibit “Loop Feedback Loop: The Big Picture of Traffic Control In Los Angeles” in March 2004 at the Center for Land Use Interpretation in association with the Institute for Advanced Architecture. More information is available at www.clui.org
- See Katherine Hayles’s book My Mother Was a Computer: Digital Subjects and Literary Texts (Chicago: University of Chicago Press, 2005), or the sentence from Anne Balsamo’s Technologies of the Gendered Body that inspired her title: “My mother was a computer, but she never learned to drive.”
- Cited in Jane Holtz Kay, Asphalt Nation (Berkeley: University of California Press,1997).
- R. A. Paxton, “Traffic Engineering and Control Before the Motor Vehicle,” Traffic Engineering & Control, August 1969.
- Burton Marsh, “Traffic Control,” Annals of the American Academy of Political and Social Sciences, July 1927, p. 91.
- William Phelps Eno, letter to Nation’s Traffic, December 1927.
- Marsh, “Traffic Control.”
- Bernard T. Schad, Traffic Control at Signalized Street Intersections (dissertation, University of Michigan, 1935), p. 101. It should also be noted that, according to the Oxford English Dictionary, the word robot once referred to automatic traffic signals in South Africa.
- The incident stream inexplicably went down at the time of Reagan’s funeral.
- From: Msg@Sigalert.com, Subject: Possible Fatality—405 South Before Getty Center Dr, Date: 6 April 2004,16:26:29 PDT.
- CHP Traffic Information Page, available at <cad.chp.ca.gov/>. Accessed 31 July 2004. This data is no longer available.
- CHP Traffic Information Page, available at <cad.chp.ca.gov/>. Accessed 18 January 2005. This data is no longer available.
- CHP Traffic Information Page, available at <cad.chp.ca.gov/>. Accessed 31 July 2004. This data is no longer available.
Sean Dockray is an artist at the Department of Design | Media Arts at the University of California, Los Angeles. He is a co-producer of Building Sound, a program dedicated to exploring radio as a medium for architectural representation. See www.la.advancedarchitecture.org [link defunct—Eds.].
Steve Rowell is a designer, photographer, and videographer. He is co-director of the Center for Land Use Interpretation in Los Angeles. His 2005 research will focus on the growing disaster-scenario culture and structures of extreme duration and containment in America, as well as on developing a series of remote monitoring devices.
Fiona Whitton is an architectural designer and curator. She is the director of Telic Gallery, a media arts space in Los Angeles.
Spotted an error? Email us at corrections at cabinetmagazine dot org.
If you’ve enjoyed the free articles that we offer on our site, please consider subscribing to our nonprofit magazine, which includes unlimited access to all our archives.