The new public spaces that I am interested in are very large-scale conversations (VLSC). On the one hand, very large-scale conversation is a medium that those who inhabit the Internet know very well. Usenet newsgroups, large email listserves, and other places on the Internet where large volumes of email are exchanged are good examples. On the other hand, from the perspective of the history of media and public space, very large-scale conversation is an entirely new and mostly unexplored phenomenon. At no other point in history have we had a medium that supports many-to-many communications between hundreds or thousands of people. VLSC takes place across international borders, often on a daily or hourly basis. Unlike with older media—for instance, telephones—participants in these very large-scale conversations usually do not know the addresses of the others before the start of a conversation. VLSC on the Internet is a new space where people who might never have known of one another’s existence are now forging bonds. A space has opened in which, with some good luck and hard work, new forms of relations might be forged. Naturally, this vision about the future of a networked society involving a proliferation of global conversation implies an optimism and perhaps, as some critics would have it, a naïveté.
If I want to participate in one of these huge discussions, my problem is this: How can I listen to thousands of others? And, conversely, how can my words be heard by the thousands of others who might be participating in the same conversation? Phrased as a design problem, the question becomes the following: What software can be designed to help participants navigate these new public spaces? Toward this goal, I have designed the Conversation Map system.
The conversation map
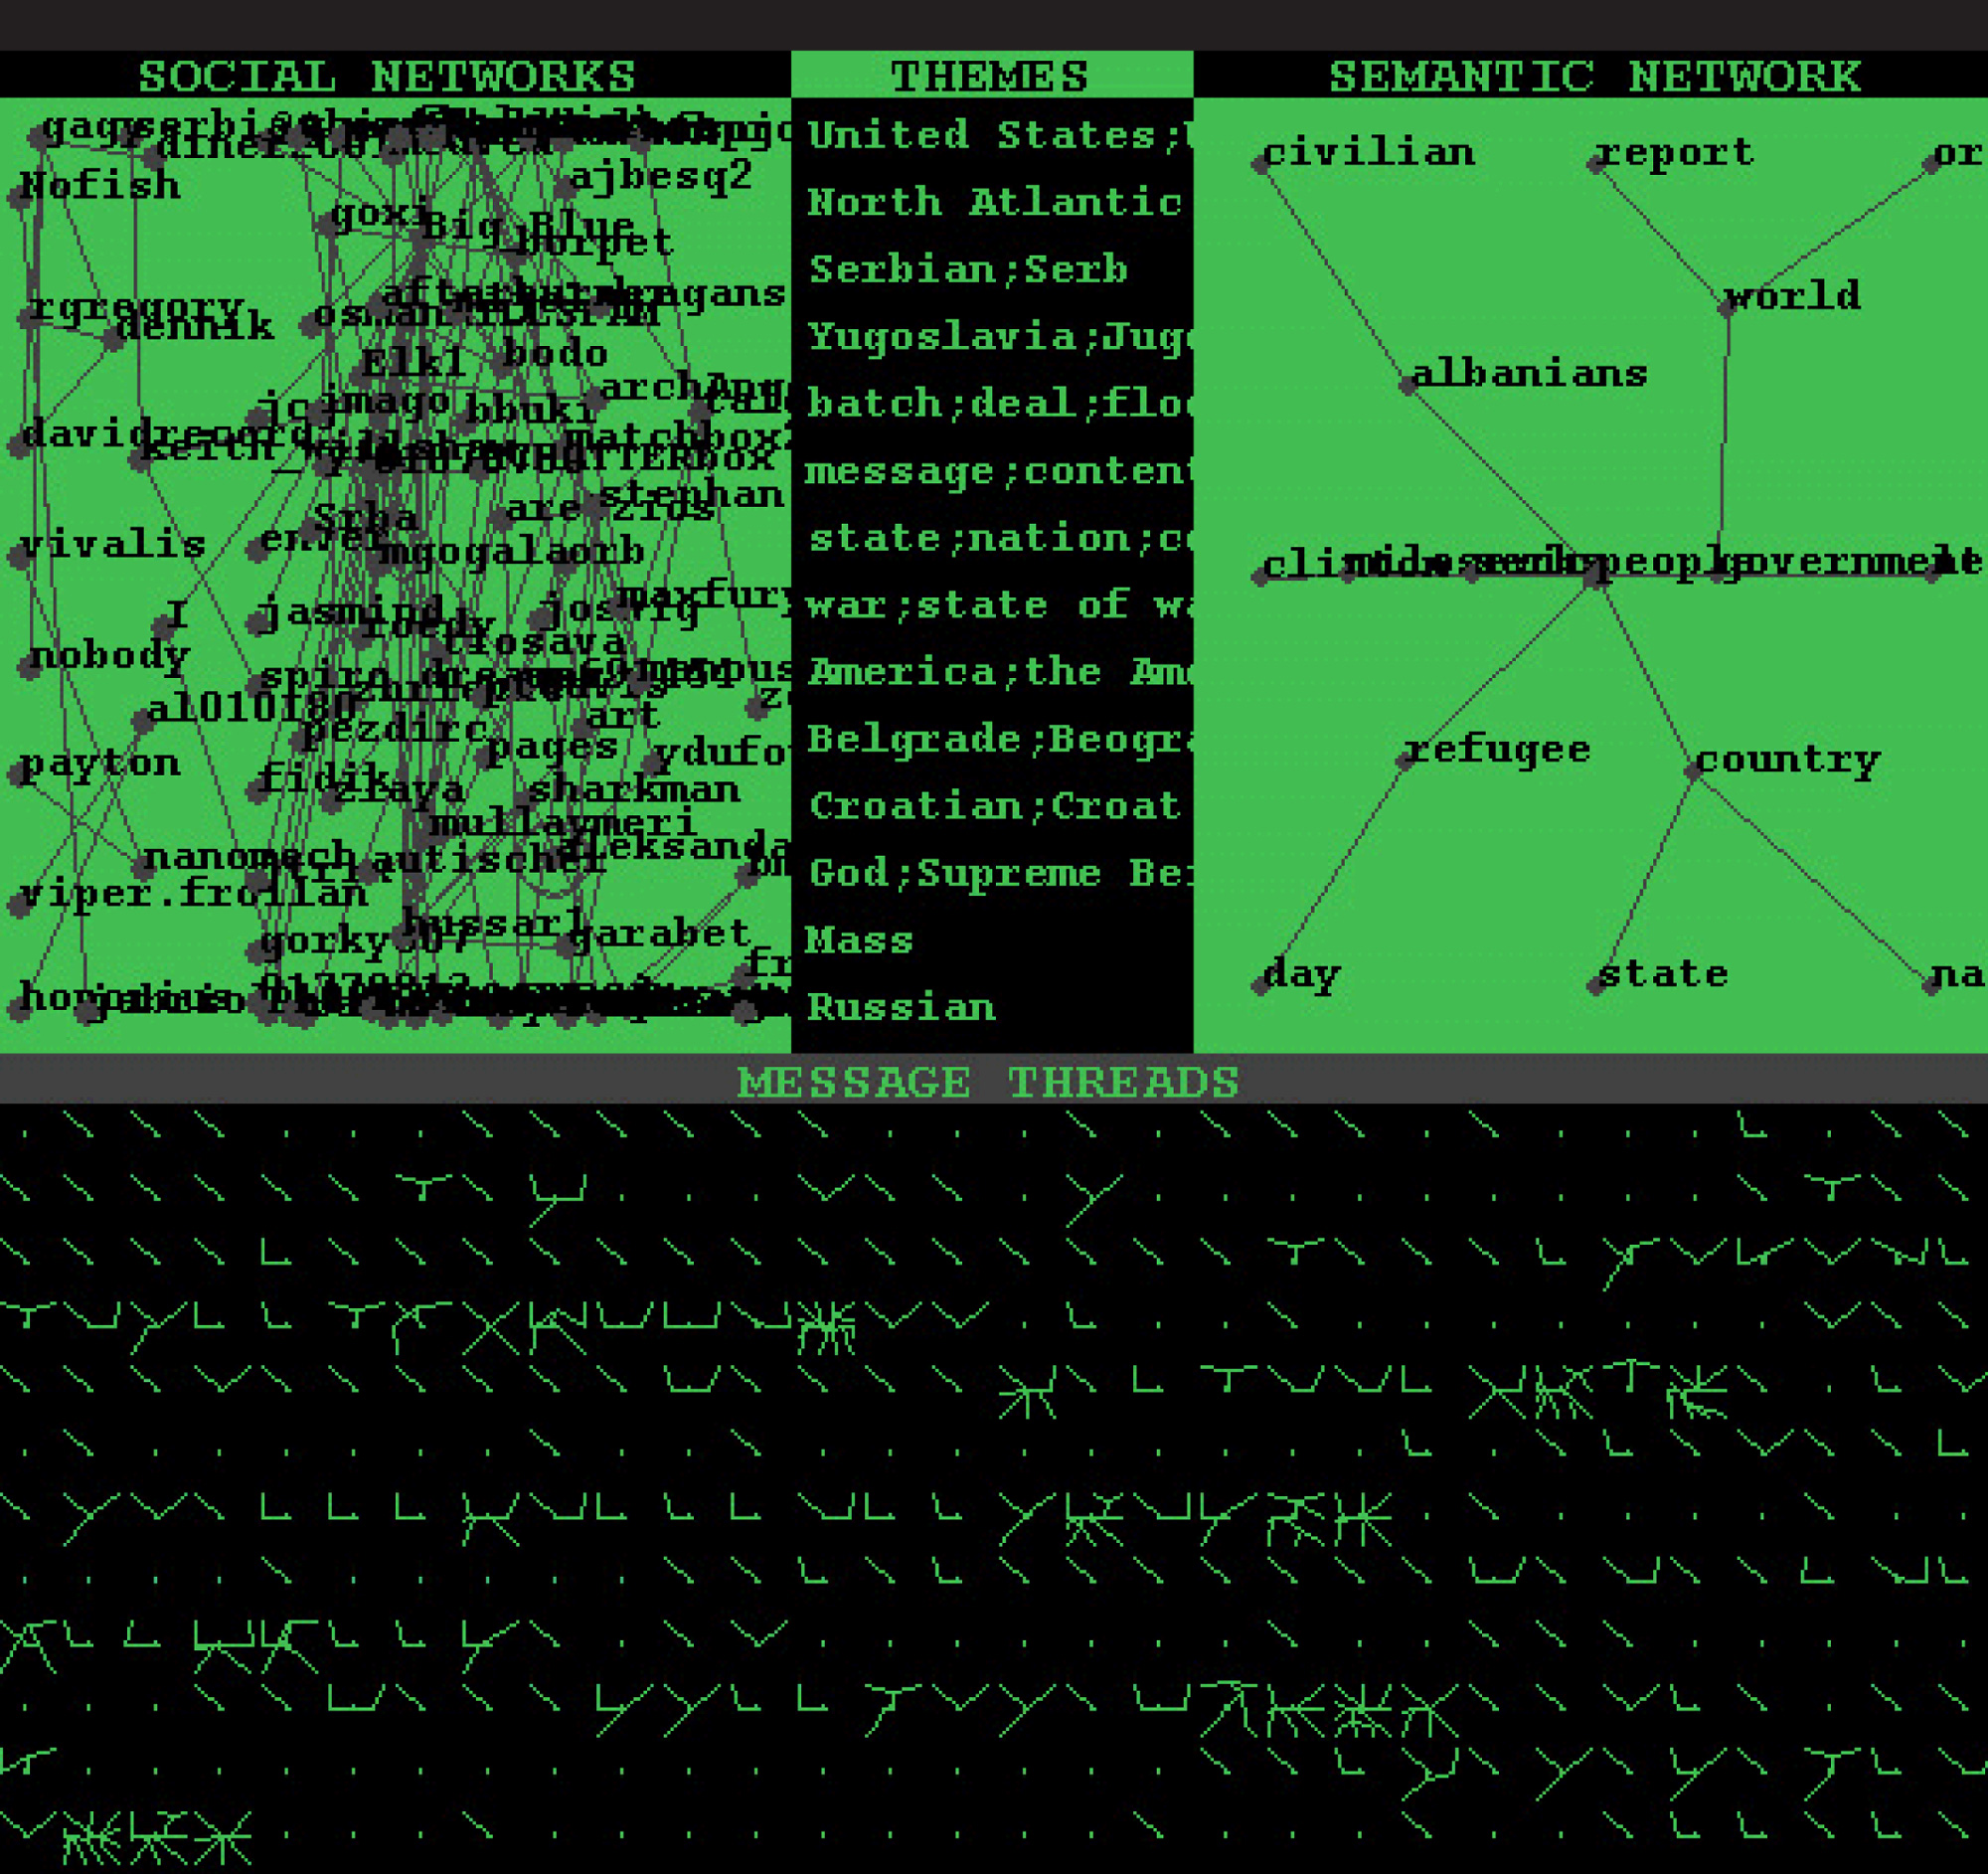
Given a few hundred or even a few thousand email messages, the Conversation Map system analyzes those messages using a set of sociological and computational linguistics techniques. This automatic analysis yields three sorts of interrelated summaries. The “Social Network” is a summary of who is talking with whom. “Themes” is a summary of the topics embodied in the messages that are important to the conversation. The “Semantic Network” is a summary that is perhaps the most interesting of all. The Conversation Map system generates a sort of rough-draft thesaurus. This thesaurus can be under-stood as a network of definitions or metaphors of the discussion that have emerged over the course of the conversation. It might reveal that the group is inventing new words or new ways of talking about known subjects. To do this, all of the content of the email messages is analyzed and “summed together” using several techniques of computational linguistics. The “soc.culture.albanian” images on the opposite page were generated by the Conversation Map system after it analyzed about 1,300 messages posted to the Usenet newsgroup “soc.culture.albanian” in the spring of 1999. It is a graphical summary of a large argument that engaged Albanians, Serbs, and others during the war in Kosovo.
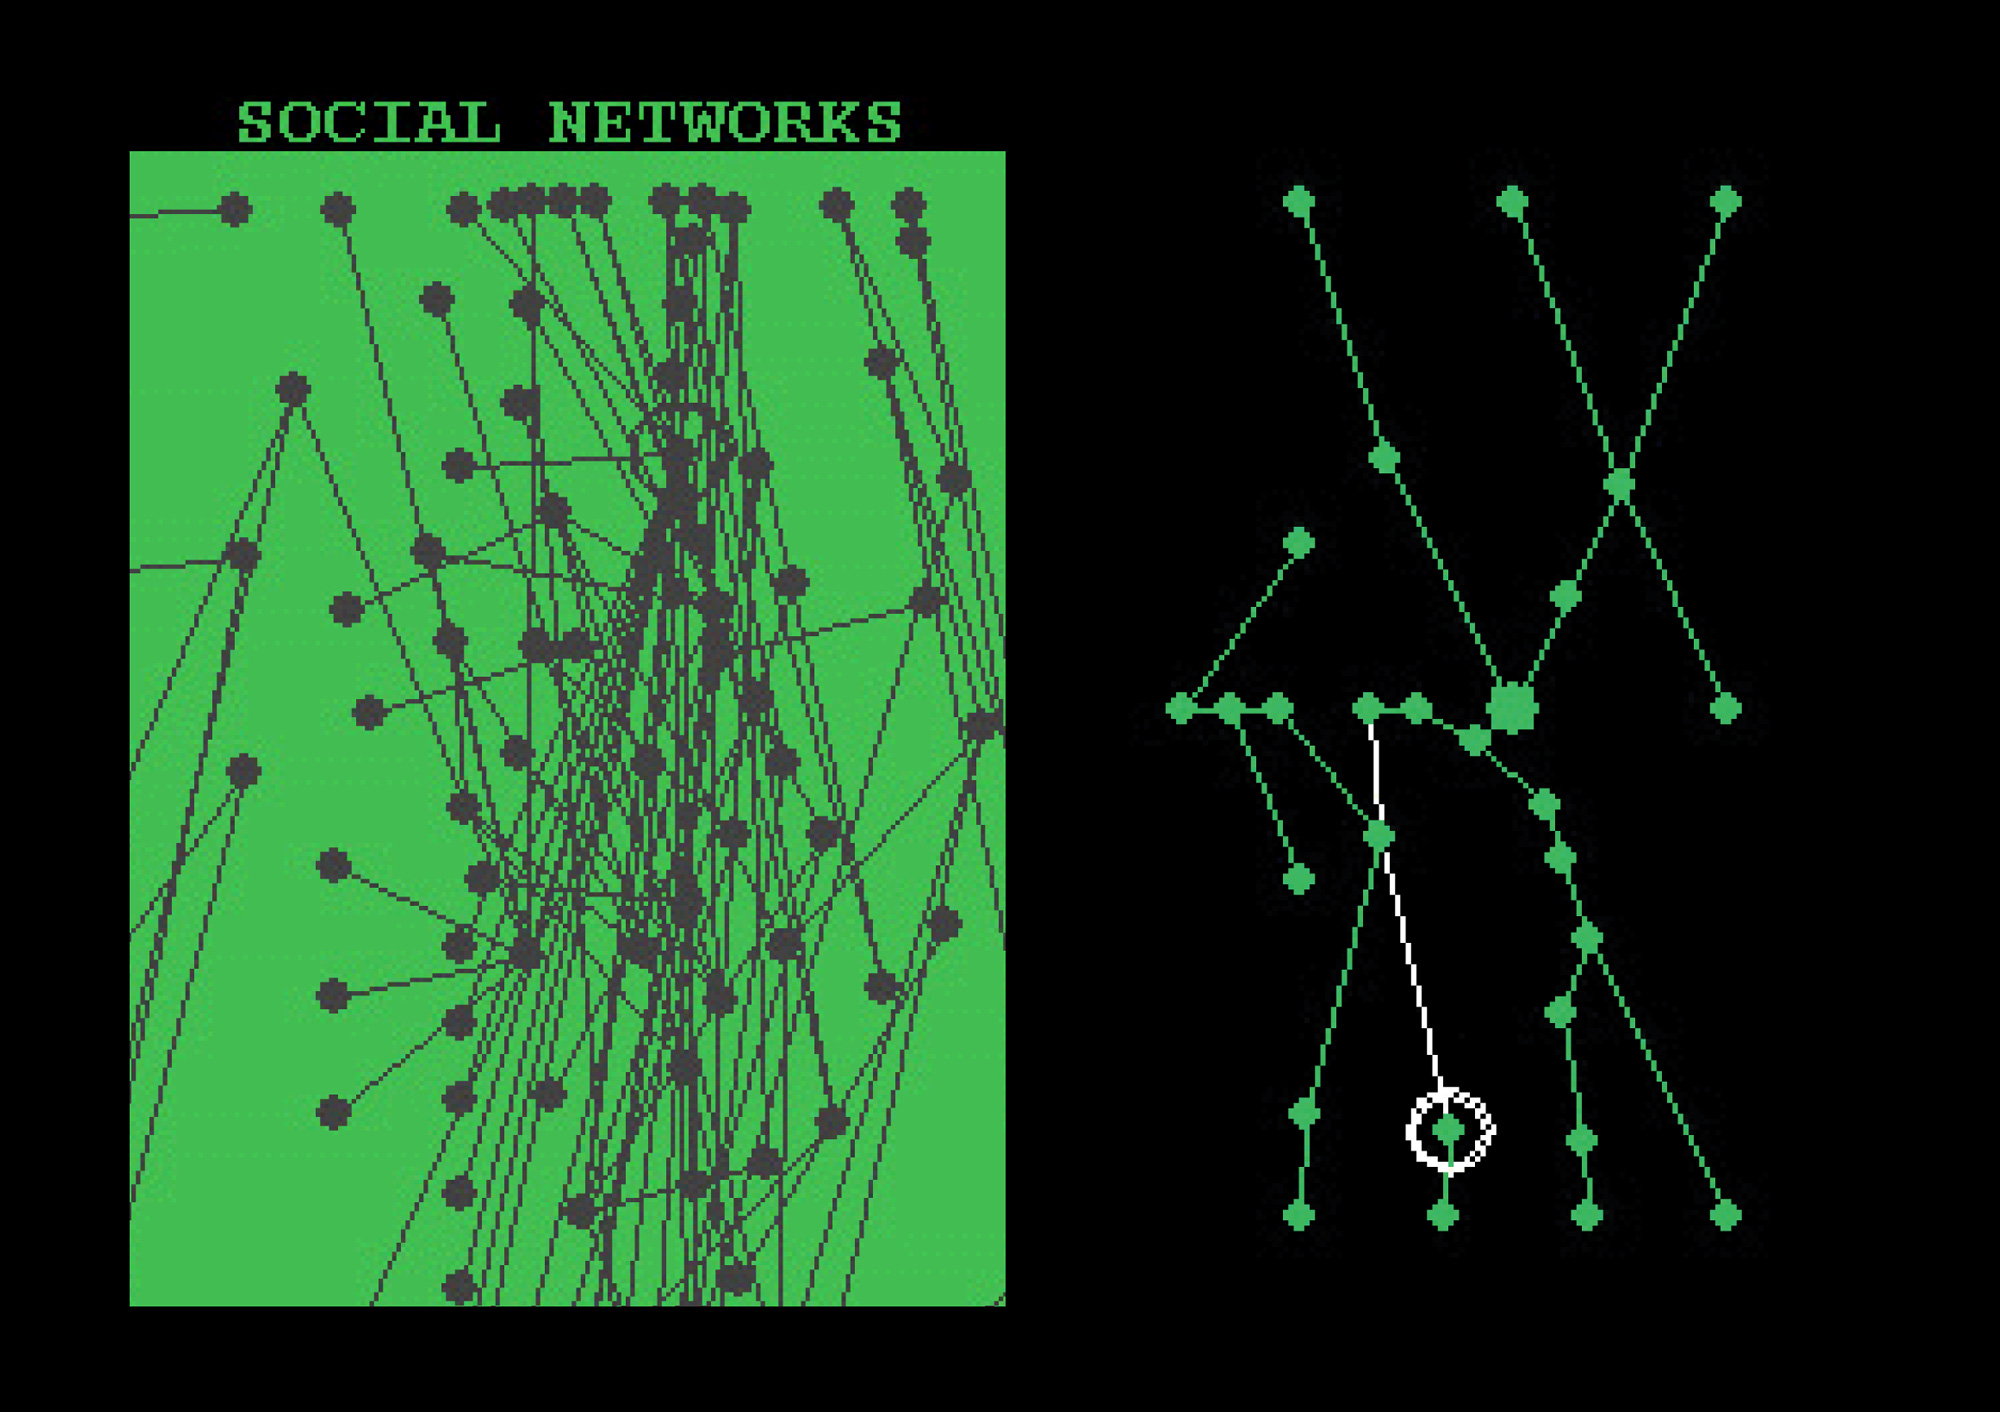
Social networks
The upper left quadrant of the Conversation Map shows a set of social networks that record who is reciprocating with whom. By “reciprocating,” I mean who is mutually responding to and/or quoting from whom. Thus, if I were to post a message to the newsgroup and then you were to respond to it and then, later in the discussion, you were to post to the newsgroup and I replied to—or quoted from—your original message, then the two of us would be reciprocating with one another. As reciprocating participants of the discussion, you and I will appear as nodes in the graphs representing social networks and a line will be drawn between us. If we reciprocate many times over the course of the conversation we will be plotted close together. In contrast, those pairs of participants who reciprocate only once will be plotted relatively far apart. Those participants who show up closely connected are pushed to the middle of the graph and can be understood as virtual mediators of the newsgroup. To end up in such a position one needs not only to post many messages but also to have others in the group reply to or quote from many of one’s messages. So, the social network display acts both as a filter for spammers and a means to identify some of the main players in a discussion.
Images courtesy Warren Sack.
Themes
The menu in the upper-middle of the interface lists
the “themes” of the conversation. Let’s say I post a message about
football, and then you respond with a message that includes some
reference to baseball. Then, perhaps later in the discussion, you post
a message about skiing and I respond with one concerning skating. Our
reciprocation will be represented in the social network, but some
approximation to the theme of our exchange will also be listed in the
menu of themes. In this case, since football, baseball, skiing, and
skating are all sports, the term “sports” might be listed on the menu
of themes. Calculating that these four terms are all sports requires,
of course, a machine-readable thesaurus. The thesaurus employed in the
Conversation Map system is WordNet.
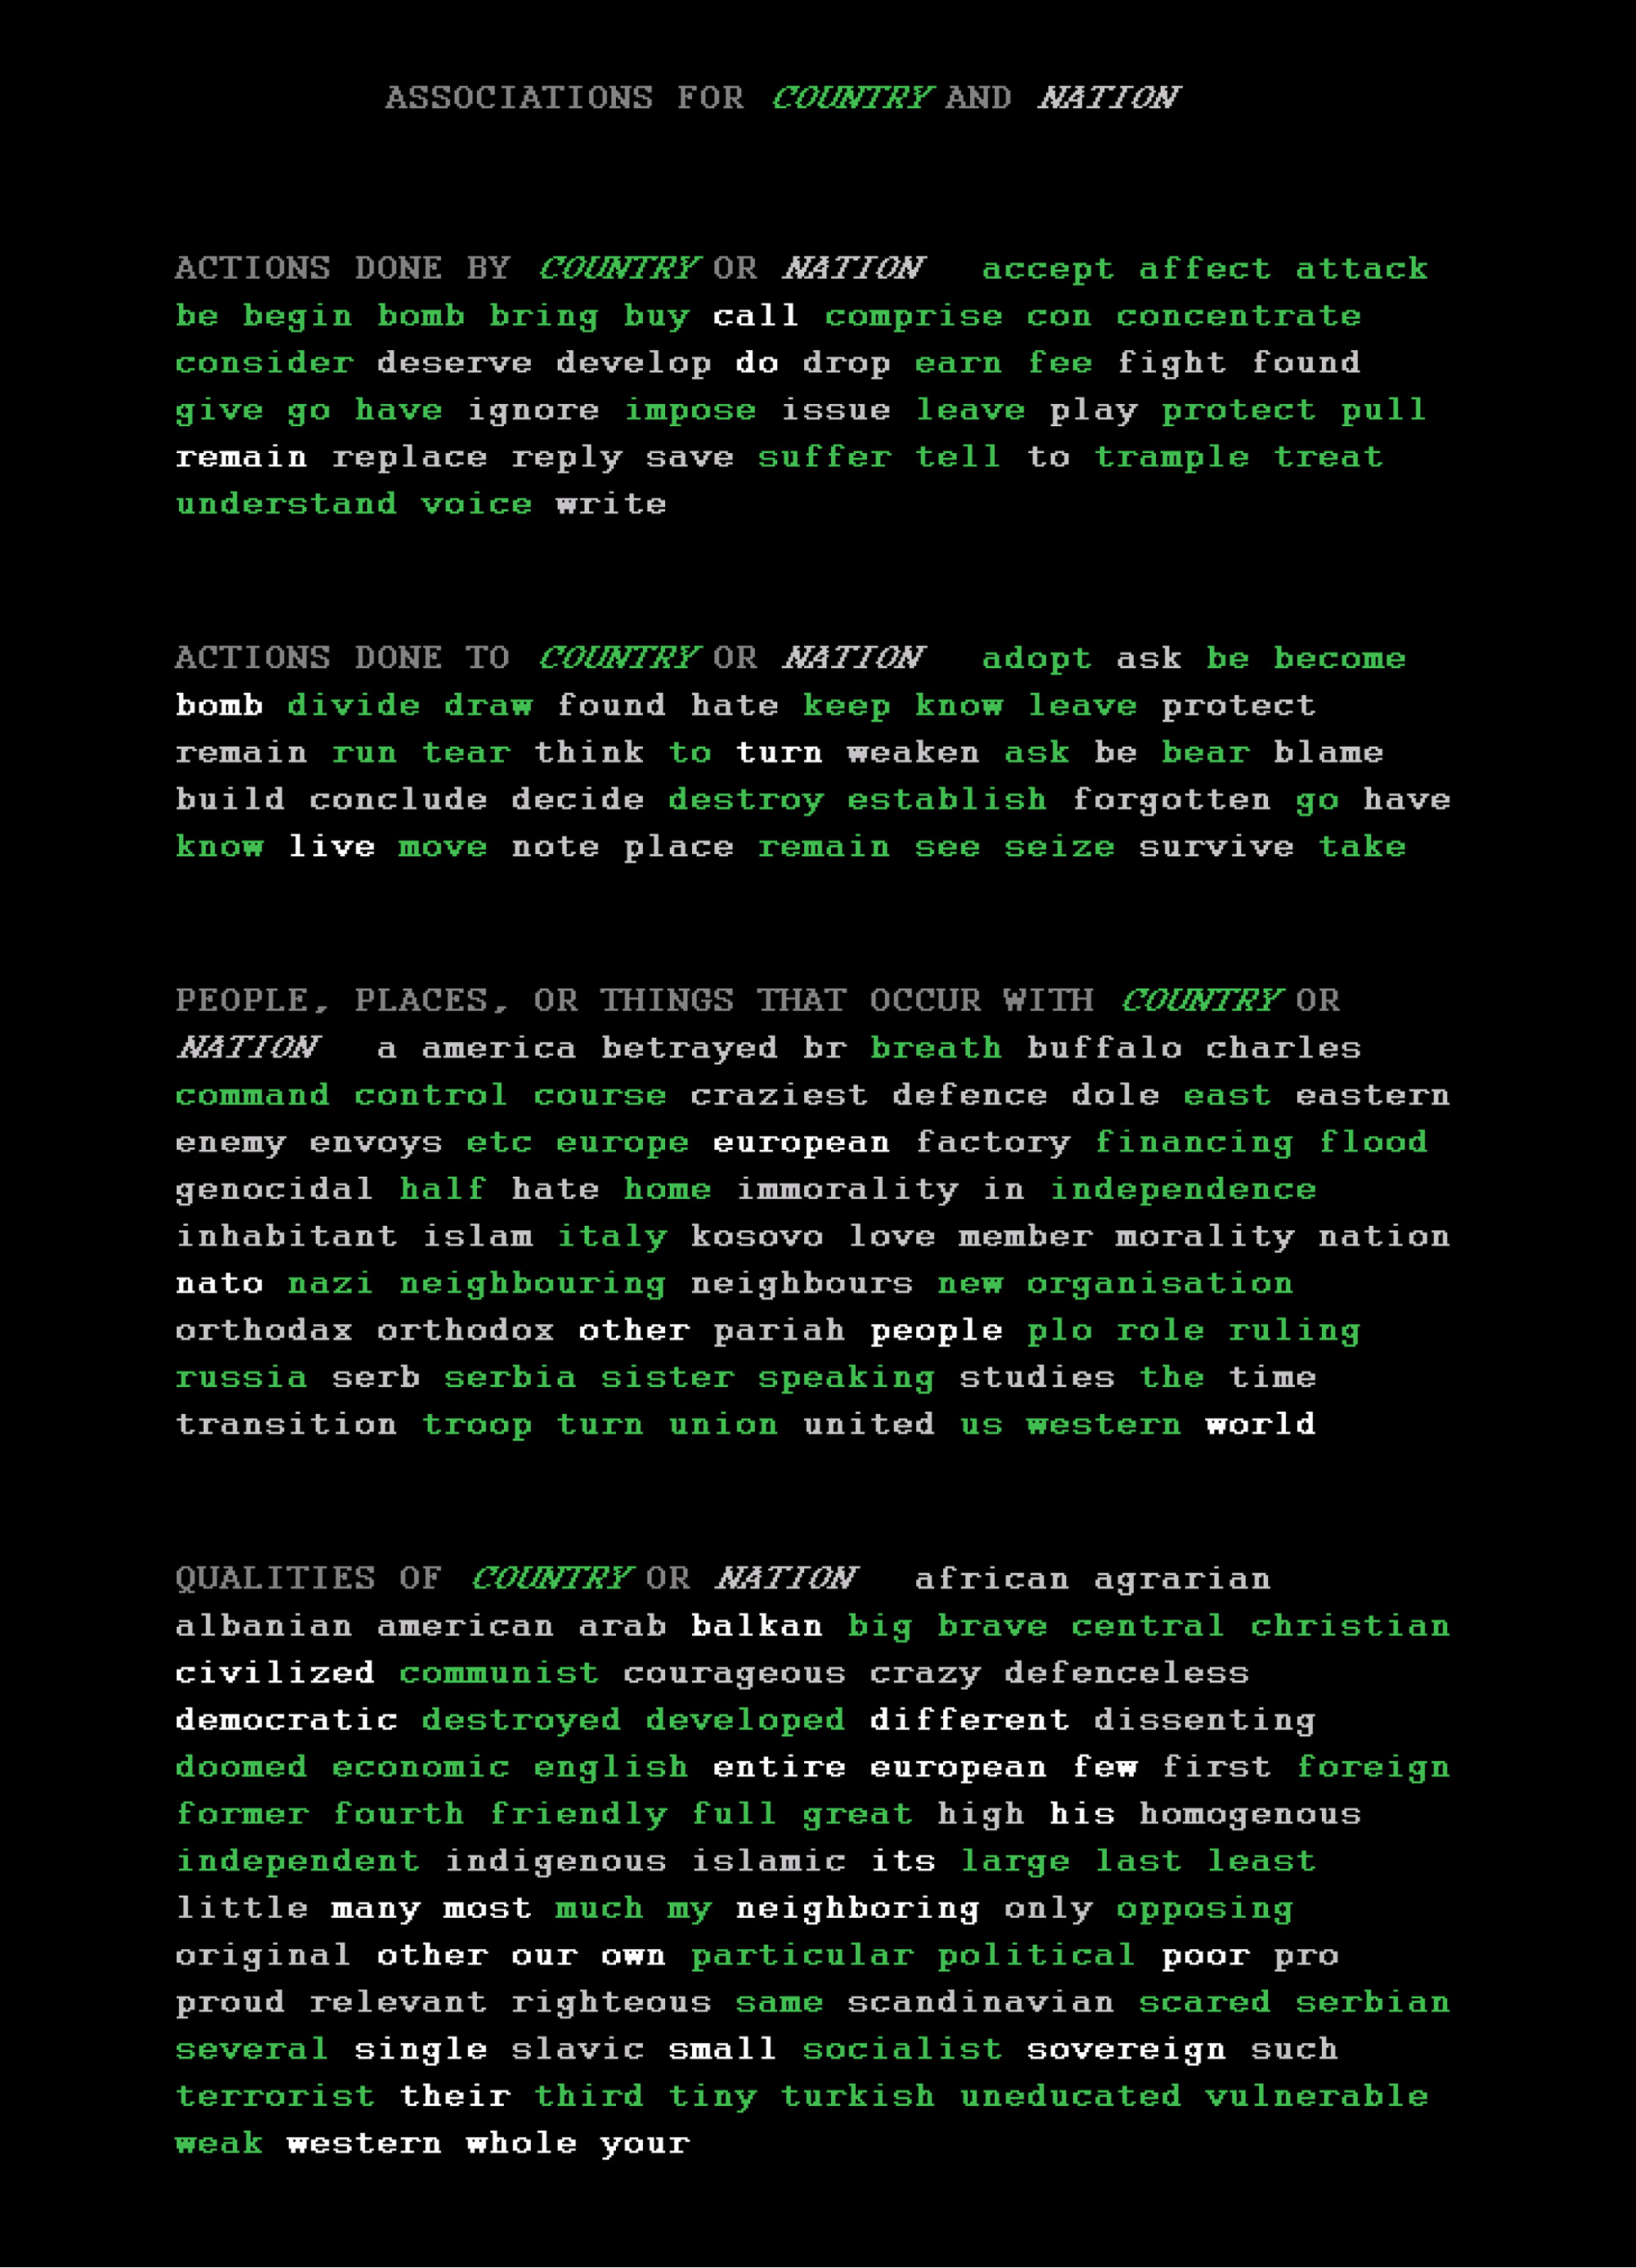
Semantic network
One way to understand the
difference between the menu of themes and the graph depicted in the
upper right-hand corner of the interface is this: While construction of
the menu of themes requires the use of a pre-defined thesaurus, the
calculations performed to create the semantic network in the upper
right-hand corner automatically generate a rough-draft thesaurus. To
create a rough-draft thesaurus the Conversation Map system does the
following: First, the content of all of the messages exchanged during
the conversation is parsed—i.e., subjects, verbs, objects and some
other modifying relations are identified between the words of each
sentence in the texts of the messages. Next, a profile is built for
each noun in the corpus of messages. By “profile,” I mean that for each
noun a vector is created that records a) all of the verbs for which the
subject functioned as a subject; b) all of the verbs for which the noun
functioned as an object; c) all of the adjectives which modified the
noun; and so forth. Once a profile has been calculated for each noun,
the nouns’ profiles are compared to one another and each noun’s nearest
neighbor is identified. If two nouns are nearest neighbors then,
according to this calculation, they appear in similar contexts. Or, to
put it more plainly, if two nouns have similar profiles, then they can
be said to have been “talked about” in similar ways by the participants
in the discussion. On the semantic network, if two nouns are nearest
neighbors, then they are plotted as two nodes connected to one another.
Why, one might ask, is this sort of analysis of interest
for the navigation of very large-scale conversations? To answer this
question, I compare this sort of analysis with some work done by the
cognitive scientists George Lakoff and Mark Johnson. In their book Metaphors We Live By
they claim that one emergent metaphor of our culture is, for instance,
that “arguments are buildings.” As part of their method they show how
two nouns, which might be considered, a priori, to be completely
unalike, show up in very similar contexts. For example, one can say,
“The building is shaky” but one can also say, “The argument is shaky.”
One can say, “The building collapsed,” and also “The argument
collapsed.” Similarly, both buildings and arguments can be said to have
“foundations,” “to stand,” and “to fall”; “ be constructed,” “be
supported,” “ be buttressed,” etc. A set of similar sentences of this
sort provides an empirical means for thinking about and discovering how
definitions and metaphors are produced over the course of a large
amount of discussion. Thus, this tool for automatic, rough-draft
thesaurus generation can be seen as “training wheels” to allow us,
within the context of a specific conversation, to begin to generate the
sorts of hypotheses that Lakoff and Johnson explore in their book. So,
the Conversation Map gives some data exploration/navigation tools to
start to understand how different conversations differ from one another
according to the metaphors and definitions that are produced by the
collective efforts of their participants.
Image courtesy Warren Sack.
Message archive
The lower half of the interface
is a graphical representation of all of the messages that have been
parsed and analyzed by the Conversation Map system. Messages are
organized into threads where a thread is simply defined as an initial
post, all of the responses to the initial post and all of the responses
to responses. The threads are organized in chronological order; the
first thread posted to the newsgroup appears in the upper left-hand
corner and the last thread posted appears in the lower right-hand
corner. If a thread contains many messages, it shows up as a green
square on this display. If a thread contains few messages, then it
shows up as a black square. Thus a rough guide to the posting activity
in the newsgroup over the period of time spanned by the messages is
displayed.
New social formations
Very large-scale
conversation is a new kind of public space and new types of social
formations are facilitated or engendered by it.
I am exploring four of these new sorts of social formation:
— One area of online conversation that I am interested in is national
and international discourse about so-called “mass” media, especially
television. Certain television shows have over one billion viewers.
Despite the content, the sheer size of their audience makes them worthy
of serious consideration. Internet discussions about television shows
make it clear that audiences are not “masses.” They are, rather, highly
interconnected groups of people negotiating the meaning and
significance of shows, characters, and studio politics in daily,
international, online forums.
— With the anthropologist Joseph Dumit I am also
exploring very large-scale conversations that focus on medicine and
health issues. Gulf War syndrome, multiple chemical sensitivity,
chronic fatigue syndrome, and attention deficit disorder are all
examples of what Dumit calls “illnesses you have to fight to get.” Many
medical and insurance industries refuse to recognize their existence.
Consequently, the sufferers mobilize amongst themselves to get the
status of their illness changed and thus recognized so that they will
be treated by medical practitioners and reimbursed for medical costs by
their insurance companies. Since it is rarely the case that sufferers
are geographically localized or members of some pre-established
lobbying group, the Internet is an essential forum for their
self-organization into cohesive groups.
— Probably the most widely recognized of the new social
formations engendered by online communications is the Open Source
Movement. Technical discussions and exchanges over the Internet have
resulted in new pieces of software—e.g., Linux—that constitute a new
social and economic force and challenge existing products and
conventional production methodologies—e.g., Microsoft’s production of
the Windows operating system. Very large-scale conversations devoted to
technical issues are often some of the most tight-knit and productive
of online forums.
— Finally, the newsgroup analyzed for the Conversation
Map summary of “soc.culture.albanian” is an example of people
functioning as “citizen diplomats.” Ordinary citizens are now
conducting international relations through their discussions with
ordinary citizens in other hostile and friendly nations. These
discussions are often very messy. However, even in the form they take
today, these very large-scale conversations point to new possibilities
in the conduct of international relations.
Mapping public space and navigating social formations
The
Conversation Map makes some of the social relations produced through
online conversation visible by diagramming them as social networks. It
identifies and sorts the themes of discussion according to their
importance in the social network. Thus, the menu of themes gives one
some insight into what is central to the conversation. Finally, if one
wants to explore hypotheses concerning possible emergent metaphors of
discourse, the Conversation Map provides a tool that can help one make
these sorts of hypotheses. All of these dimensions of online
conversation—social networks, themes of discussion, and emergent
metaphors and definitions—are indicative of the new social formations
produced in the public spaces of very large-scale conversation.
More information about this project can be found in the
publications and working demos at www.sims.berkeley.edu/~sack/CM. [link
defunct—Eds.]
Warren Sack is a software designer and media theorist. Prior to joining the faculty at University of California–Berkeley in the fall of 2000, Sack was a research scientist at the MIT Media Laboratory and a member of the Interrogative Design Group at the MIT Center for Advanced Visual Studies.
Spotted an error? Email us at corrections at cabinetmagazine dot org.
If you’ve enjoyed the free articles that we offer on our site, please consider subscribing to our nonprofit magazine, which includes unlimited access to all our archives.