Fall 2011
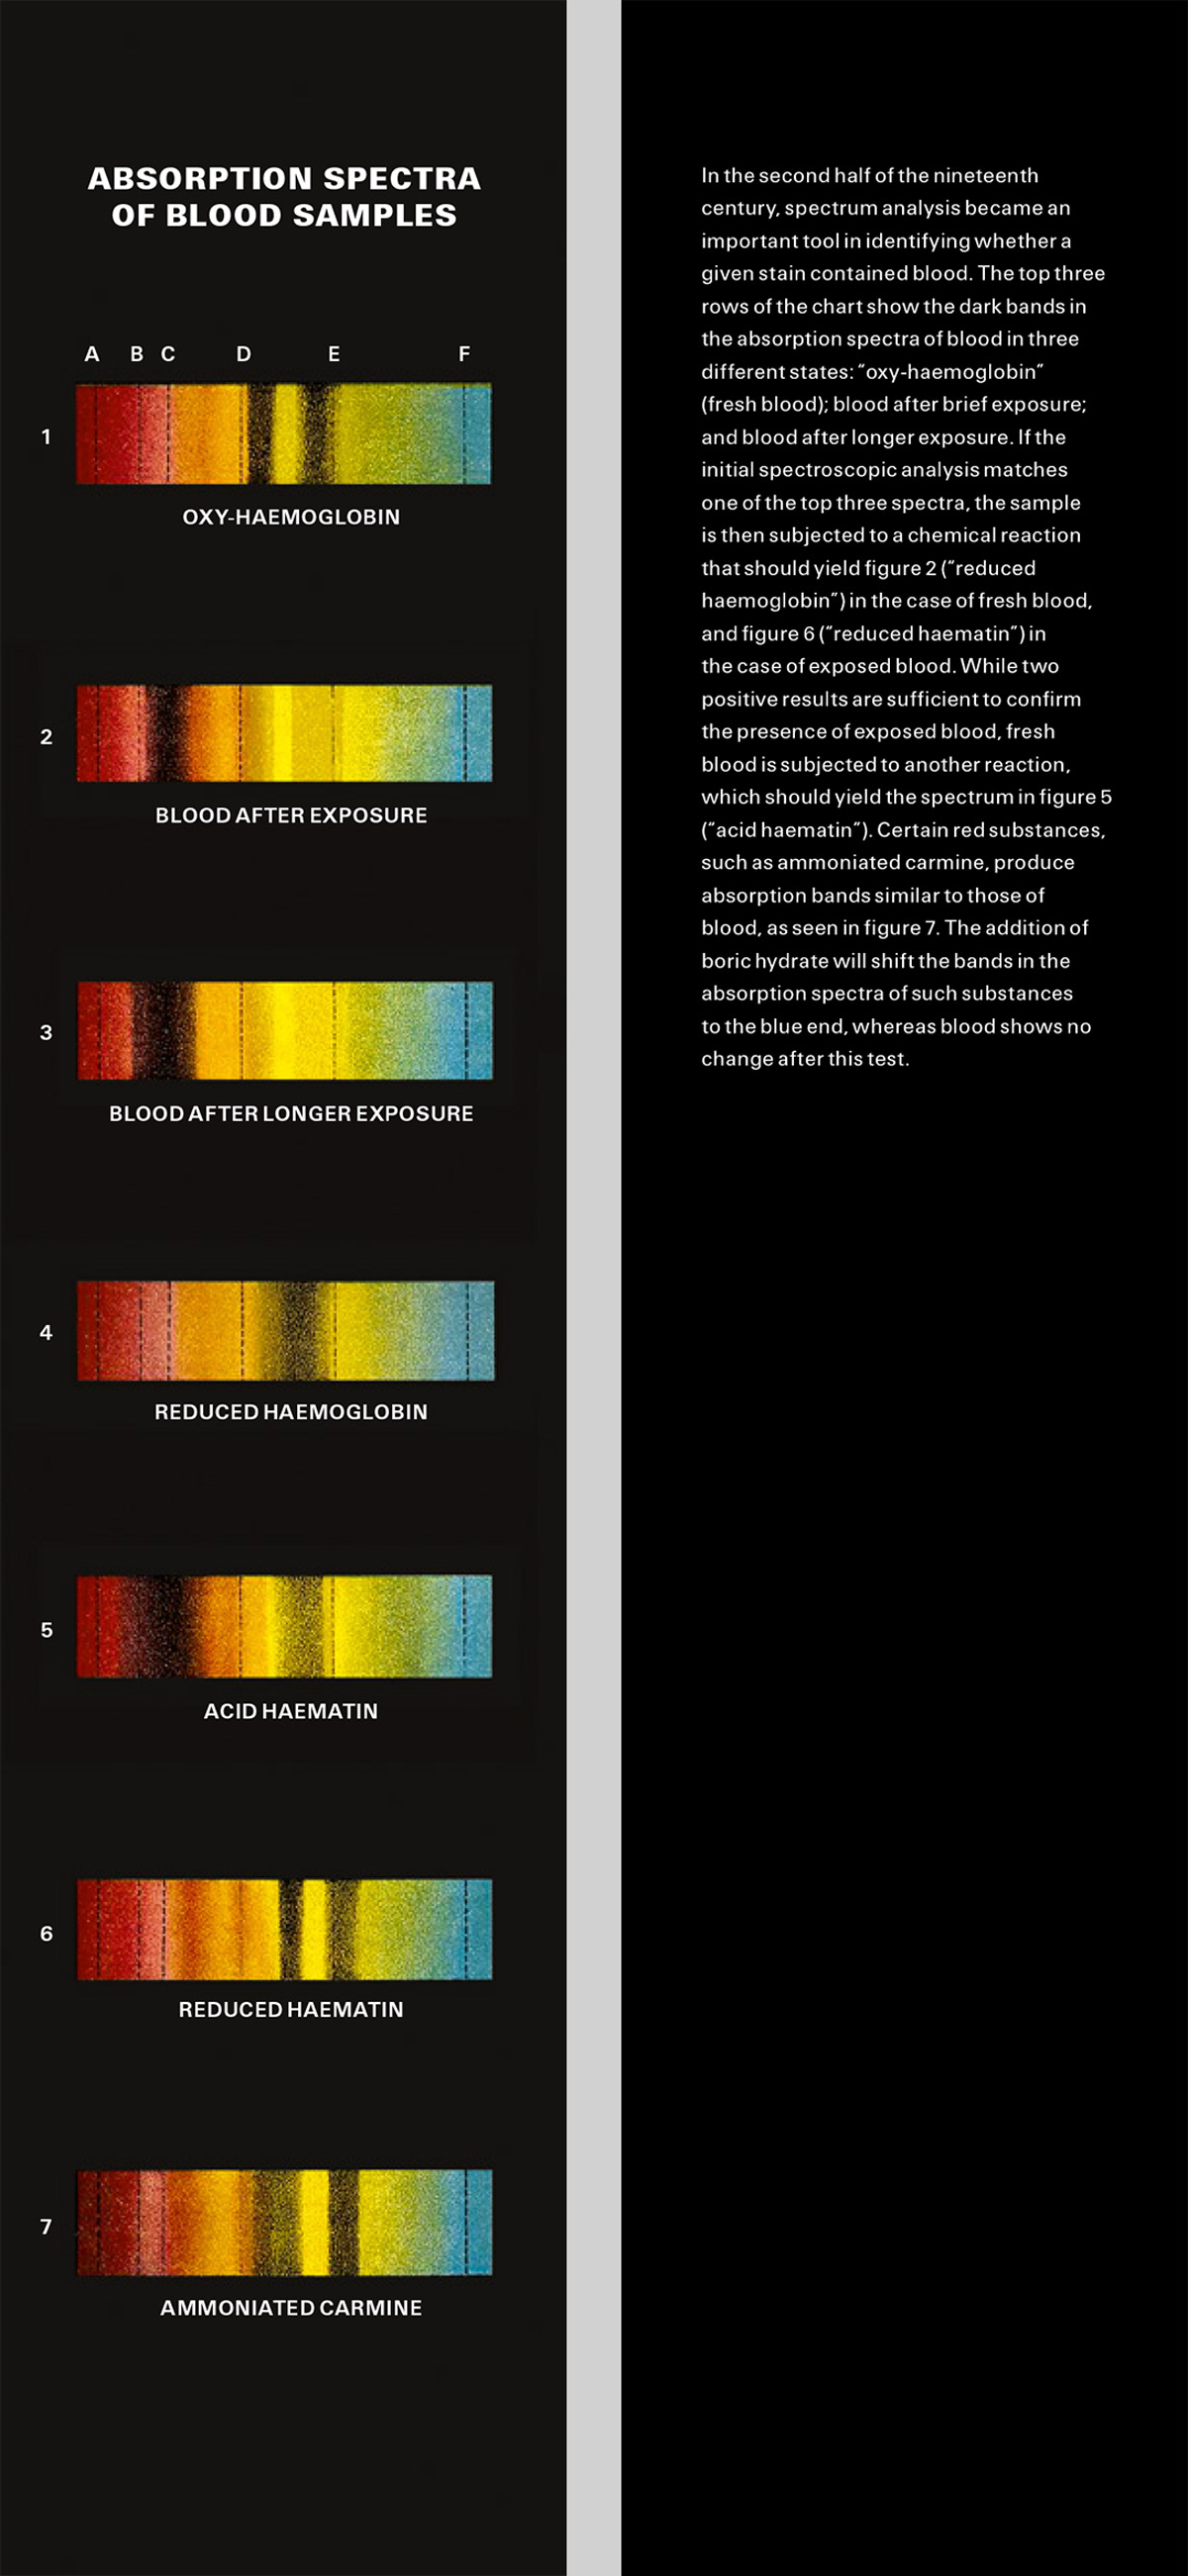
Bookmark / Absorption Spectra of Blood Samples
Out damned spot!
Spotted an error? Email us at corrections at cabinetmagazine dot org.
If you’ve enjoyed the free articles that we offer on our site, please consider subscribing to our nonprofit magazine, which includes unlimited access to all our archives.